Our value added statement
for the year ended 31 December 2012
| |
2012 |
|
2011 |
|
2010 |
|
| |
Rm |
|
% |
|
Rm |
|
% |
|
Rm |
|
% |
|
| Wealth created |
|
|
|
|
|
|
|
|
|
|
|
|
| Revenue and other income |
141 792 |
|
|
|
128 331 |
|
|
|
116 813 |
|
|
|
| Other finance costs |
(6 035) |
|
|
|
(3 279) |
|
|
|
(3 107) |
|
|
|
| Operating expenses |
(78 801) |
|
|
|
(69 113) |
|
|
|
(68 828) |
|
|
|
| |
56 956 |
|
|
|
55 939 |
|
|
|
44 878 |
|
|
|
| Wealth applied |
|
|
|
|
|
|
|
|
|
|
|
|
| Employees |
7 775 |
|
14 |
|
6 754 |
|
12 |
|
5 961 |
|
13 |
|
| Debt providers |
4 088 |
|
7 |
|
3 331 |
|
6 |
|
3 064 |
|
7 |
|
| Governments and regulators |
21 025 |
|
37 |
|
22 067 |
|
40 |
|
19 026 |
|
42 |
|
| Ordinary shareholders |
14 919 |
|
26 |
|
11 722 |
|
21 |
|
6 313 |
|
14 |
|
| Non-controlling interests |
3 364 |
|
6 |
|
3 033 |
|
5 |
|
2 527 |
|
6 |
|
| Reinvestment into MTN |
5 785 |
|
10 |
|
9 032 |
|
16 |
|
7 987 |
|
18 |
|
| |
56 956 |
|
100 |
|
55 939 |
|
100 |
|
44 878 |
|
100 |
|
| Capex |
30 101 |
|
|
|
17 717 |
|
|
|
19 466 |
|
|
|
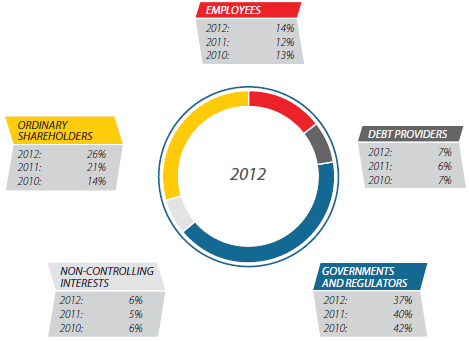
 Distribution of wealth Distribution of wealth |
 |
• |
People |
| |
We invested nearly R8 billion in our employees through salaries, pension plans, training and medical insurance. |
|
| |
• |
Shareholders |
| |
We paid R15 billion in dividends to our shareholders. |
|
| |
• |
Countries |
| |
We pay over R21 billion in taxation, regulatory fees and revenue share in the countries we operate in. |
|
| |
• |
Infrastructure |
| |
We invested over R30 billion in expanding and upgrading our infrastructure which positions us well into the future. |
|
|


