
| Currently viewing: Group chief financial officer’s report / Next: Five-year financial review |
 |
 |
 |
Downloads |  |
Home |
Group chief financial officer’s report
|

MTN delivered satisfactory financial results supported by a sound operational performance. The reduction in tariffs by competitors resulted in a change in traffic patterns impacting voice revenues. Data usage showed an upward trend compensating slower growth in voice revenues, while cost containment initiatives continued to gain momentum, allowing the Group to maintain a healthy EBITDA margin. This enabled MTN to increase returns to shareholders, taking the dividend yield to 5,2% from 3,7% a year earlier.
However, the strong rand against the US$ continued to negatively impact Group results. This is despite the weakening of the rand to the US$ in the second half of the year. The once-off profit impact on the sale of the Ghana towers has been separated in the analysis.
On 14 February 2012, Moody’s upgraded MTN’s global local currency senior unsecured rating to Baa2 from Baa3 and its national scale issuer rating to A1.za from A2.za. The outlook on all ratings is positive.
Considerations for the period
Changes in ownership
 |
In August 2011, MTN settled the Nigeria put option through the acquisition of the IFC interest and thereby increased its shareholding in the company from 76,08% to 78,83%. |
|
In October 2011, MTN increased its shareholding in MTN Rwanda from 55% to 80%. |
|
In April 2011, MTN reduced its shareholding in MTN Zambia from 90% to 86%. For IFRS consolidation purposes, the step down in equity shareholding has not impacted the proportionate consolidation at 97,8% as risks and rewards are not deemed to have passed to the purchaser. |
|
In February 2011, MTN Rwanda sold its 70% investment in Supercell. |
Put options
As detailed above, the Nigerian put option was settled in August 2011, resulting in movements of R254 million in finance costs, R266 million in fair value adjustments, R205 million in forex losses and R138 million in non‑controlling interests’ share of profits. The much smaller Afghanistan put option resulted in R31 million of forex gains and R2 million in non‑controlling interests’ share of profits in the current year.
Currency
Currency continued to have a meaningful impact on the results, reducing local currency growth rates when translated to rand. The average Nigerian naira exchange rate dropped 5% against the rand, the Iranian rial lost 5% and the Ghanaian cedi was 10% weaker.
The individual country analysis is covered in pages 38 to 47, giving more detail on individual country performance. A high-level review of the consolidated results follows.
| Profit analysis R million |
2011 | 2010 | Variance % |
|||||
| Airtime and subscription | 79 854 | 78 400 | 1,9 | |||||
| Interconnect | 18 530 | 17 012 | 8,9 | |||||
| Data | 8 096 | 6 206 | 30,5 | |||||
| SMS | 7 501 | 6 570 | 14,2 | |||||
| Mobile telephones and accessories | 5 030 | 3 678 | 36,7 | |||||
| Other | 2 873 | 2 818 | 1,9 | |||||
| Total revenue | 121 884 | 114 684 | 6,3 | |||||
| Other income | 1 458 | — | — | |||||
| Direct network operating costs | 18 782 | 16 818 | (11,7) | |||||
| Costs of handsets and other accessories | 8 160 | 6 819 | (19,7) | |||||
| Interconnect and roaming costs | 13 395 | 12 593 | (6,4) | |||||
| Employee bene ts costs | 6 754 | 5 961 | (13,3) | |||||
| Selling, distribution and marketing expenses | 14 805 | 14 741 | (0,4) | |||||
| Other | 6 696 | 10 215 | 34,4 | |||||
| Total costs | 68 591 | 64 174 | (6,9) | |||||
| EBITDA | 54 750 | 47 537 | 15,2 | |||||
| EBITDA margin % | 44,9% | 41,5% | 3,4 pct points | |||||
| MTN Zakhele costs | — | 2 973 | ||||||
| Pro t from sale of Ghana towers | 1 185 | — | ||||||
| EBITDA | 53 565 | 50 510 | 6,0 | |||||
| EBITDA margin % | 43,9 | 44,0 | (0,1) pct points | |||||
| Capex | 17 717 | 19 466 | (9,0%) |
Revenue analysis
Revenue increased by 6,3% as MTN grew its subscriber base by 16,2% to 164,5 million users. Revenue growth in local currencies continued to reflect more positively due to the dampening effect of a strong rand. In Nigeria, Iran and Ghana, MTN operations enjoyed local currency growth of 9,6%, 26,5% and 15,1% respectively. However, with approximately 68% of MTN’s earnings generated outside South Africa, the translation into rand of the 2011 results had a significant impact on final reported Group figures.
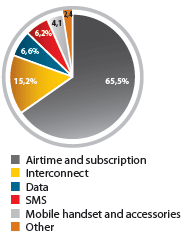
The contribution of airtime and subscription revenue reduced to 65,5% from 68,4% for the prior year, mainly due to slower growth in Nigeria and Syria. Notwithstanding lower termination rates in some countries, total Group interconnect revenue increased by 8,9% as incoming traffic increased in Nigeria and Ghana on increased competition. Interconnect revenue in South Africa bucked the trend, reducing 9,8% as termination rates declined in line with the predetermined glide path without a meaningful change in incoming traffic.
Total revenue analysis
 |
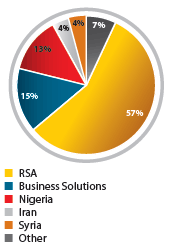 |
Data revenue (excluding SMS) across the Group remained strong, increasing 30,5%, driven by an increase in data traffic of 55%. South Africa contributed 57% of the total Group data revenue (excluding SMS). This strong performance from South Africa, particularly in the second half of the year, was the main driver of total data revenue growth for the year. This should not undermine the importance of data as a revenue contributor from countries outside of South Africa. Data growth doubled in Nigeria over the year, increasing its contribution to Group data revenues to 13% from 9% in the previous year. SMS also continued to grow strongly.
Handset revenues increased on higher prepaid handset volumes in South Africa as well as on increased demand for smartphones.
Other income
Other income includes the Group’s profit on the sale of the Ghana towers of R1 185 million as well as a deferred gain of R273 million.
Cost analysis
Total operating costs increased by 2%, lower than revenue growth. This is mainly due to higher direct network operating costs due to an increased number of sites, higher fuel costs, including electricity and diesel, and higher transmission costs in South Africa. This was offset by lower selling, distribution and marketing expenses in almost all operations, lower professional fees and other operating expenses thanks to tighter cost management.
Handset costs are directly related to handset sales. Employee benefits increased due to high inflation and competition for human resources across the footprint. Insourcing of IT in South Africa also had a negative impact on employee costs but a positive impact on IT costs.
The Group’s reported EBITDA margin increased by 3,4 percentage points to 44,9%. However, when adjusted for one-time MTN Zakhele costs in 2010 and the Ghana tower sale profit in 2011, the EBITDA margin was marginally down at 43,9%. The strong performance considering revenue pressures was due to margin expansion in South Africa and Iran and despite a small deterioration in margins in Nigeria.
Capital expenditure
Following a peak in network infrastructure investments in 2008 and 2009, MTN reduced overall capital expenditure to R17,7 billion from R19,5 billion in the prior year. The ratio of capex to revenue declined to 14,5% from 17,0% in 2010 and 27,9% in 2009. Capital expenditure was below that authorised for the period by approximately 20% mainly due to slower spend in Nigeria and Iran. However, execution in the second half was significantly up on the first half of the year with 68% of all capital expenditure being capitalised after June 2011. The strong momentum is anticipated to continue into 2012 as most of the unspent capital expenditure in 2011 had already been committed by year-end. The stronger rand had a positive impact on capital expenditure during the year.
Capital expenditure

Interest and tax
| Net finance cost breakdown (Rm) |
2011 | 2010 | % change |
|||||
| Net finance costs | ||||||||
| Net interest paid | 1 454 | 1 925 | 24,4 | |||||
| Net forex losses | 744 | 924 | 19,5 | |||||
| Functional currency (gains)/losses | (778) | 1 223 | 163,6 | |||||
| Put option | 162 | 22 | (686,4) | |||||
| 1 582 | 4 094 | 61,4 |
| Tax table (Rm) | 2011 | 2010 | % change |
|||||
| Tax analysis | ||||||||
| STC, WHT and CGT | 2 580 | 1 450 | (77,9) | |||||
| Deferred tax | 1 089 | 1 984 | 45,1 | |||||
| Normal tax | 10 184 | 7 834 | (30,0) | |||||
| Effective tax rate (%) | 36,80 | 36,27 | 0,5 pct points |
Net finance costs decreased sharply due to functional currency gains of R778 million compared with losses of R1,2 billion in the prior year. A weaker rand in the second half of the year resulted in realised gains on the conversion of currency.
The Group’s effective tax rate increased marginally. The relatively high effective rate was mainly the result of the secondary tax on companies on higher Group dividends as well as withholding taxes related to stronger flows of cash from operations to the Group and the Ghana tower sale taxes.
Earnings per share
Adjusted headline earnings per share (HEPS) increased 43,2% to 1 070,0 cents when compared to the prior year reported number of 747,0 cents. However, the increase in the current year’s adjusted HEPS was positively impacted by charges associated with the implementation of the MTN Zakhele scheme in the prior year. If these charges were excluded, prior year adjusted HEPS would have been 909,1 cents, reducing the current year’s growth in adjusted HEPS to 17,7%.
Highlights of the statement of financial position
Assets and liabilities at 31 December 2011 were impacted by the movement in year-end foreign currency exchange rates, and in particular the weakening of the rand against the US$ to a closing rate of 8,07 versus 6,61 for the prior year.
Net cash increased meaningfully from R904 million to R11 817 million mainly due to an increase in cash balances in Nigeria and Syria. Gross interestbearing liabilities remained largely the same as in 2010. The Group’s cash and cash equivalents increased to R45,8 billion when investments in treasury bills, foreign currency deposits and bonds of R9 480 million in certain subsidiaries are included in the year-end cash balance. This was mainly due to a reduction in the capital expenditure in 2011 and despite an increase in dividends and the Company’s first buyback of shares totalling R927,3 million. The ability to utilise the strong consolidated cashflow is limited by the Group’s ability to upstream cash. There was continued focus in gearing up balance sheets of operating companies. Although there is still much to do in honing the capital structure of the underlying companies, strong upstreaming of cash has enabled the Group to meet a key objective of its financial framework: greater returns to shareholders.
Looking forward
MTN will continue to focus on margin management. It will work to offset slowing airtime revenue growth by increasing the contribution of data services, and implementing cost-containment strategies. MTN will also continue to evaluate opportunities to share both passive infrastructure as well as fibre. This will promote the strategy of monetising passive assets for cash in some instances, as well as reduce ongoing costs, with ancillary benefits for the Group’s environmental footprint. Finally, the ability to continue to return cash to shareholders at a Group level requires attention to the capital structure of the subsidiary companies and the continued upstreaming of cash.
Nazir Patel
Group CFO
March 2012
|