|
 |
|

|
| You are here: MTN large opco cluster performance review / Next: Message from our Group chief financial officer |
MTN large opco cluster performance review
MTN Irancell (financial numbers 49%)
MTN Irancell delivered a satisfactory performance, increasing its subscriber base by 2,2% to 41,4 million. This subdued growth was mainly the result of high levels of mobile penetration and increased competition. The delay in the approval of a new number range and a weaker economy further impacted growth in net additions. The numbers below exclude the adjustment made for hyperinflation: Total revenue increased by 18,3%* compared to the prior year. Outgoing voice revenue grew by 15,8%*, driven by a 5,3% increase in MOU with a marginal decline in the effective voice tariff. SMS and data revenue continued to show good growth, increasing by 18,0%* and 60,2%* respectively. Data revenue now contributes 10,3% of total revenue despite the operation not having a 3G licence. At the end of December, MTN Irancell had 10,3 million active smartphones on its network and 11,7 million data users. SMS revenue contributed 21,2% to total revenue. The number of WiMax subscribers increased by 14,3% to 339 809 at the end of December. MTN Irancell’s EBITDA margin declined by 1,4 (1,1*) percentage points to 42,8%, largely impacted by foreign currency denominated costs following the depreciation of the Iranian rial and an increase in international interconnect costs. In an effort to limit this impact going forward, MTN Irancell has renegotiated some contract terms with key vendors to mitigate the impact of costs denominated in foreign currency. During the year, the operation did well in maintaining cost increases at below the rate of inflation. MTN Irancell invested R1 758 million of capex during the year. It rolled out 746 new 2G sites and 415 km of fibre, improving the quality and capacity of the network. MTN Cameroon
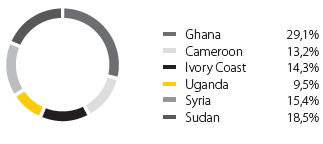
MTN Cameroon delivered a strong performance, increasing its subscriber base by 19,2% to 8,7 million at the end of December 2013. This was supported by promotional offerings to segmented groups and increased penetration levels across the countries regions. During the year, MTN launched five new service centres, improving product availability and customer service. Total revenue grew by 11,9%* despite slow economic growth and increased competition. This performance was achieved as a result of strong expansion in data revenue, which increased by 68,3%* and contributed 6,4% to total revenue. The growth in data was, however, constrained by MTN Cameroon not having a 3G licence. MTN’s attractive data bundles and value-added services such as MTN Play and Magic Voice were the main contributors to growth in data revenue. Voice revenue increased by 7,7%* despite a 39,4% decline in the effective tariff. MOU increased marginally relative to the decline in the effective tariff. Interconnect revenue also contributed to total revenue, increasing by 13,1%*. The number of registered MTN Mobile Money subscribers at the end of December was 1,4 million. Activation of subscribers as well as the roll out of a merchant network remains a priority. MTN Cameroon’s EBITDA margin, excluding profit from the sale of towers, decreased by 3,3 (3,3*) percentage points to 42,6% largely as a result of higher lease rental costs following the tower transaction. Including the tower profit, the EBITDA margin increased to 49,0%. Capex amounted to R768 million. During the year, 191 2G sites were rolled out and improvements to quality and capacity were made to high traffic sites in the main cities. MTN Ghana
MTN Ghana increased subscribers by 10,2% to 12,9 million. This was a good performance in light of a very competitive market and high levels of penetration. MTN Ghana’s performance was driven by increased regional segmentation, acquisition and retention campaigns and a focus on MTN Mobile Money. Total revenue increased by 13,0%*, supported by the 81,6%* growth in data revenue. Data contributed 9,7% to total revenue, underpinned by a 20,9% increase in data users to 4,9 million. Outgoing voice revenue increased by 7,0%*. Total revenue was impacted by lower incoming voice revenue due to reduced incoming international traffic on the network. MTN Ghana’s EBITDA margin expanded by 0,5 (0,5*) percentage points to 37,5%, supported by cost savings across various areas of the business, notably on marketing and maintenance costs. MTN Ivory Coast
MTN Ivory Coast performed well in an economy that is starting to show signs of recovery. Subscribers grew by 16,4% to 7,1 million despite aggressive competition. This was driven by effective churn management programmes, which have reduced churn rates to below 3% per month. Total revenue increased by 9,1%*, supported by a 158,9%* growth in data revenue and a 16,0%* increase in interconnect revenue. Affordable 3G handsets and value-added services accelerated this growth trend. There are currently 1,8 million smartphones on the network and this number is expected to grow further with the introduction of cheaper smartphones into the market. Voice revenue grew by 2,1%* due to lower MOU and despite a decline in the effective tariff. MTN Mobile Money started gaining momentum with an increase of 59,0% to 1,5 million registered subscribers at the end of December. The distribution network now has more than 3 000 merchants with a focus on expanding the rural footprint. The operation’s EBITDA margin excluding profits on tower sales rose by 0,6 (0,5*) of a percentage point to 40,9%, helped by notable savings made on network and marketing costs. MTN Ivory Coast spent R830 million on its capex programme, rolling out 92 new 2G sites and 84 co-located 3G sites in the year. MTN Uganda
MTN Uganda delivered a good performance, increasing its subscriber base by 14,4% to 8,8 million, driven by strong acquisition promotions, segmented offerings and the continued success of MTN Zone. Increased penetration into rural areas and improved network quality further supported this growth. Total revenue increased by 17,9%*, supported by a 51,7%* increase in data revenue and a 10,9%* increase in outgoing voice revenue. SMS revenue declined by 3,5%* as customers opted for newer data-driven social media platforms for communication. Data trends were supported by an expanded 3G network, value-added services and enhanced marketing. MTN Mobile Money continued to perform well and recorded a 47,0% increase in registered subscribers to 5,2 million with more than 25 million transactions per month. Usage was stimulated by a wider mobile payment product range. MTN Uganda’s EBITDA margin declined by 0,5 (0,5*) percentage points to 35,9%, excluding the profit from the sales of towers, mainly because of an increase in network-related and commission costs. Capex in the year amounted to R553 million, with 117 new 2G sites and 92 co-located 3G sites rolled out, significantly improving quality and capacity on the network. MTN Syria
Notwithstanding the prevailing circumstances, MTN Syria recorded a 3,3% decrease in subscribers to 5,8 million amid extremely challenging conditions. Despite a 4,2%* decline in total revenue, data revenue increased by 44,2%*. MTN Syria’s EBITDA margin declined by 5,6 (5,3*) percentage points to 17,4%. The operation’s performance will remain under pressure until the crisis in the country is resolved. MTN Sudan
MTN Sudan increased its subscriber base by 10,7% to 8,7 million and its market share to approximately 33,8%. Revenue increased by 34,5%* and the EBITDA margin expanded by 4,0 (3,9*) percentage points to 31,7%. Capex in the year amounted to R1 072 million with the roll out of 101 new 2G sites and 366 co-located 3G sites, which supported strong data growth of 202,4%*, albeit off a low base. |