


 10 / 108

Contribution
To ensure robust operational oversight across our 22 opcos and three ISP
businesses, we manage the group as follows: South Africa, Nigeria and the
SEAGHA, WECA and MENA regions and their respective underlying operations.
The CEOs of South Africa and Nigeria and vice-presidents of each region are
members of our executive committee.
Here we provide key statistics for our top seven operations, which account
for a total of 82% of group EBITDA, 80% of group revenue and 78% of
group subscribers.
Where we operate and how we performed
South Africa
Nigeria
SEAGHA
WECA
MENA
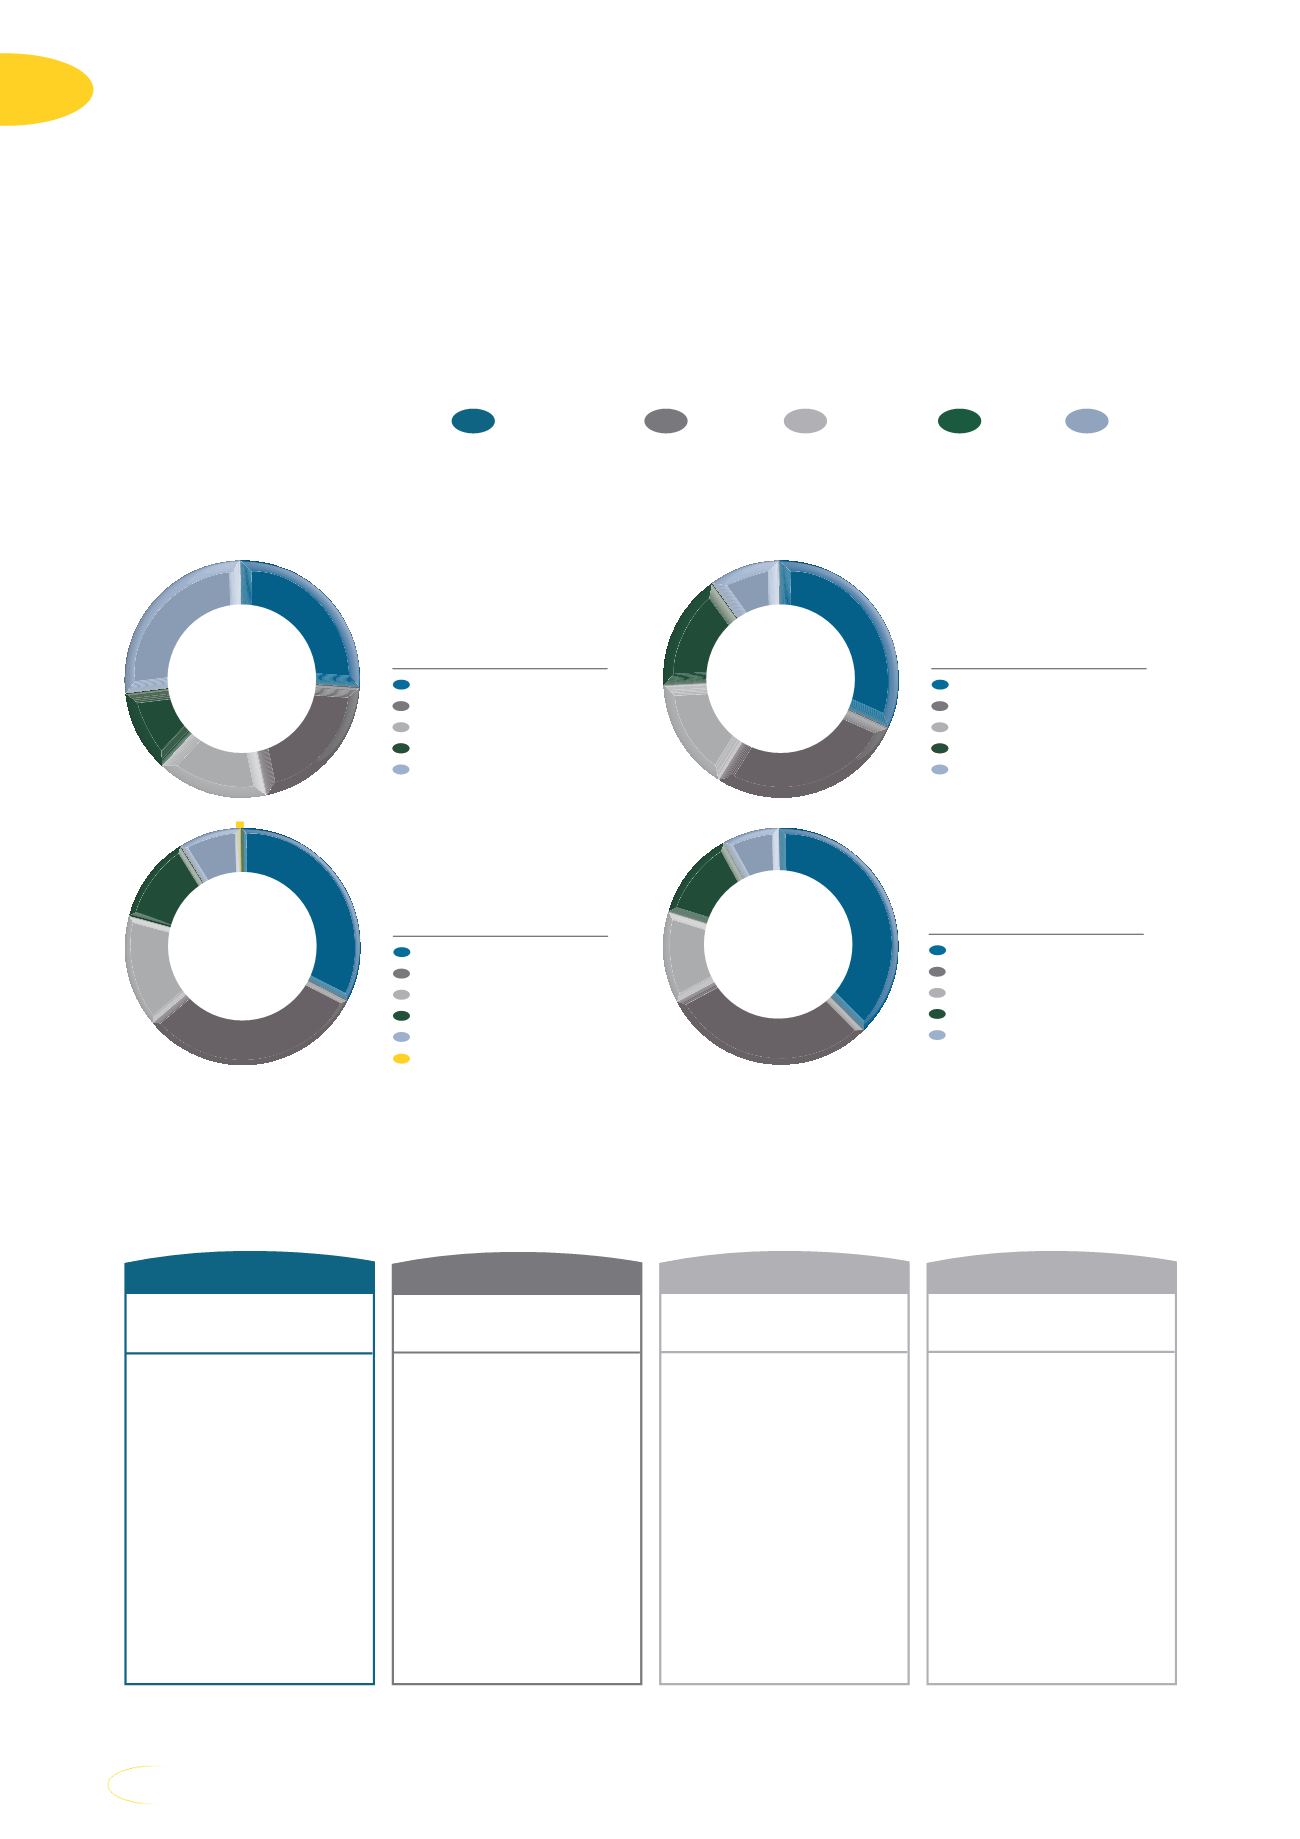
In our contribution graphs we exclude revenue, EBITDA and capex numbers for our joint venture in Iran, disclosing them separately.
Revenue
up 6,8%
*
R133
billion
South Africa
32,2%
Nigeria
27,2%
SEAGHA
15,1%
WECA
15,9%
MENA
9,6%
Subscribers
#
217,2
million
#
South Africa
13,6%
Nigeria
24,1%
SEAGHA
17,8%
WECA
13,4%
MENA
31,1%
EBITDA
up 2,5%
*
R47
billion
South Africa
33,3%
Nigeria
31,7%
SEAGHA
15,4%
WECA
12,0%
MENA
8,6%
Head Office
(1,0%)
Capex
down 10,8%
R31,5
billion
South Africa
36,5%
Nigeria
28,5%
SEAGHA
12,1%
WECA
11,7%
MENA
7,3%
‡
MTN legal ownership.
#
Using modernised definitions, which do not have comparisons.
* Constant currency and after taking into account pro forma adjustments.
** Reported – as reflected in the MTN Group Limited financial results for the year ended 31 December 2017.
In 2017, we reported total revenue of R133 billion** (2016: R148 billion**) and EBITDA of R47 billion**
(2016: R41 billion**). We had 217 million
#
subscribers.
South Africa
(100%) ‡
No 2 operator
31,2% market share
Population
56,7 million
EBITDA
R14,4 billion**
Contribution to
group EBITDA
33%
Capex
R11,5 billion**
Subscribers
#
29,5 million
Data revenue*
up 25,0%
(33% of revenue)
Ghana
(98%) ‡
No 1 operator
55,1% market share
Population
28,9 million
EBITDA
R4,1 billion**
Contribution to
group EBITDA
9%
Capex
R2,2 billion**
Subscribers
#
15,7 million
Data revenue*
up 50,6%
(25% of revenue)
Uganda
(96%) ‡
No 1 operator
55,9% market share
Population
42,9 million
EBITDA
R1,8 billion**
Contribution to
group EBITDA
4%
Capex
R0,9 billion**
Subscribers
#
10,7 million
Data revenue*
up 41,4%
(10% of revenue)
Nigeria
(79%) ‡
No 1 operator
42,1% market share
Population
190,9 million
EBITDA
R14,0 billion**
Contribution to
group EBITDA
32%
Capex
R9,0 billion**
Subscribers
#
52,3 million
Data revenue*
up 86,6%
(12% of revenue)
08
MTN Group Limited
Integrated Report 2017