


 16 / 108

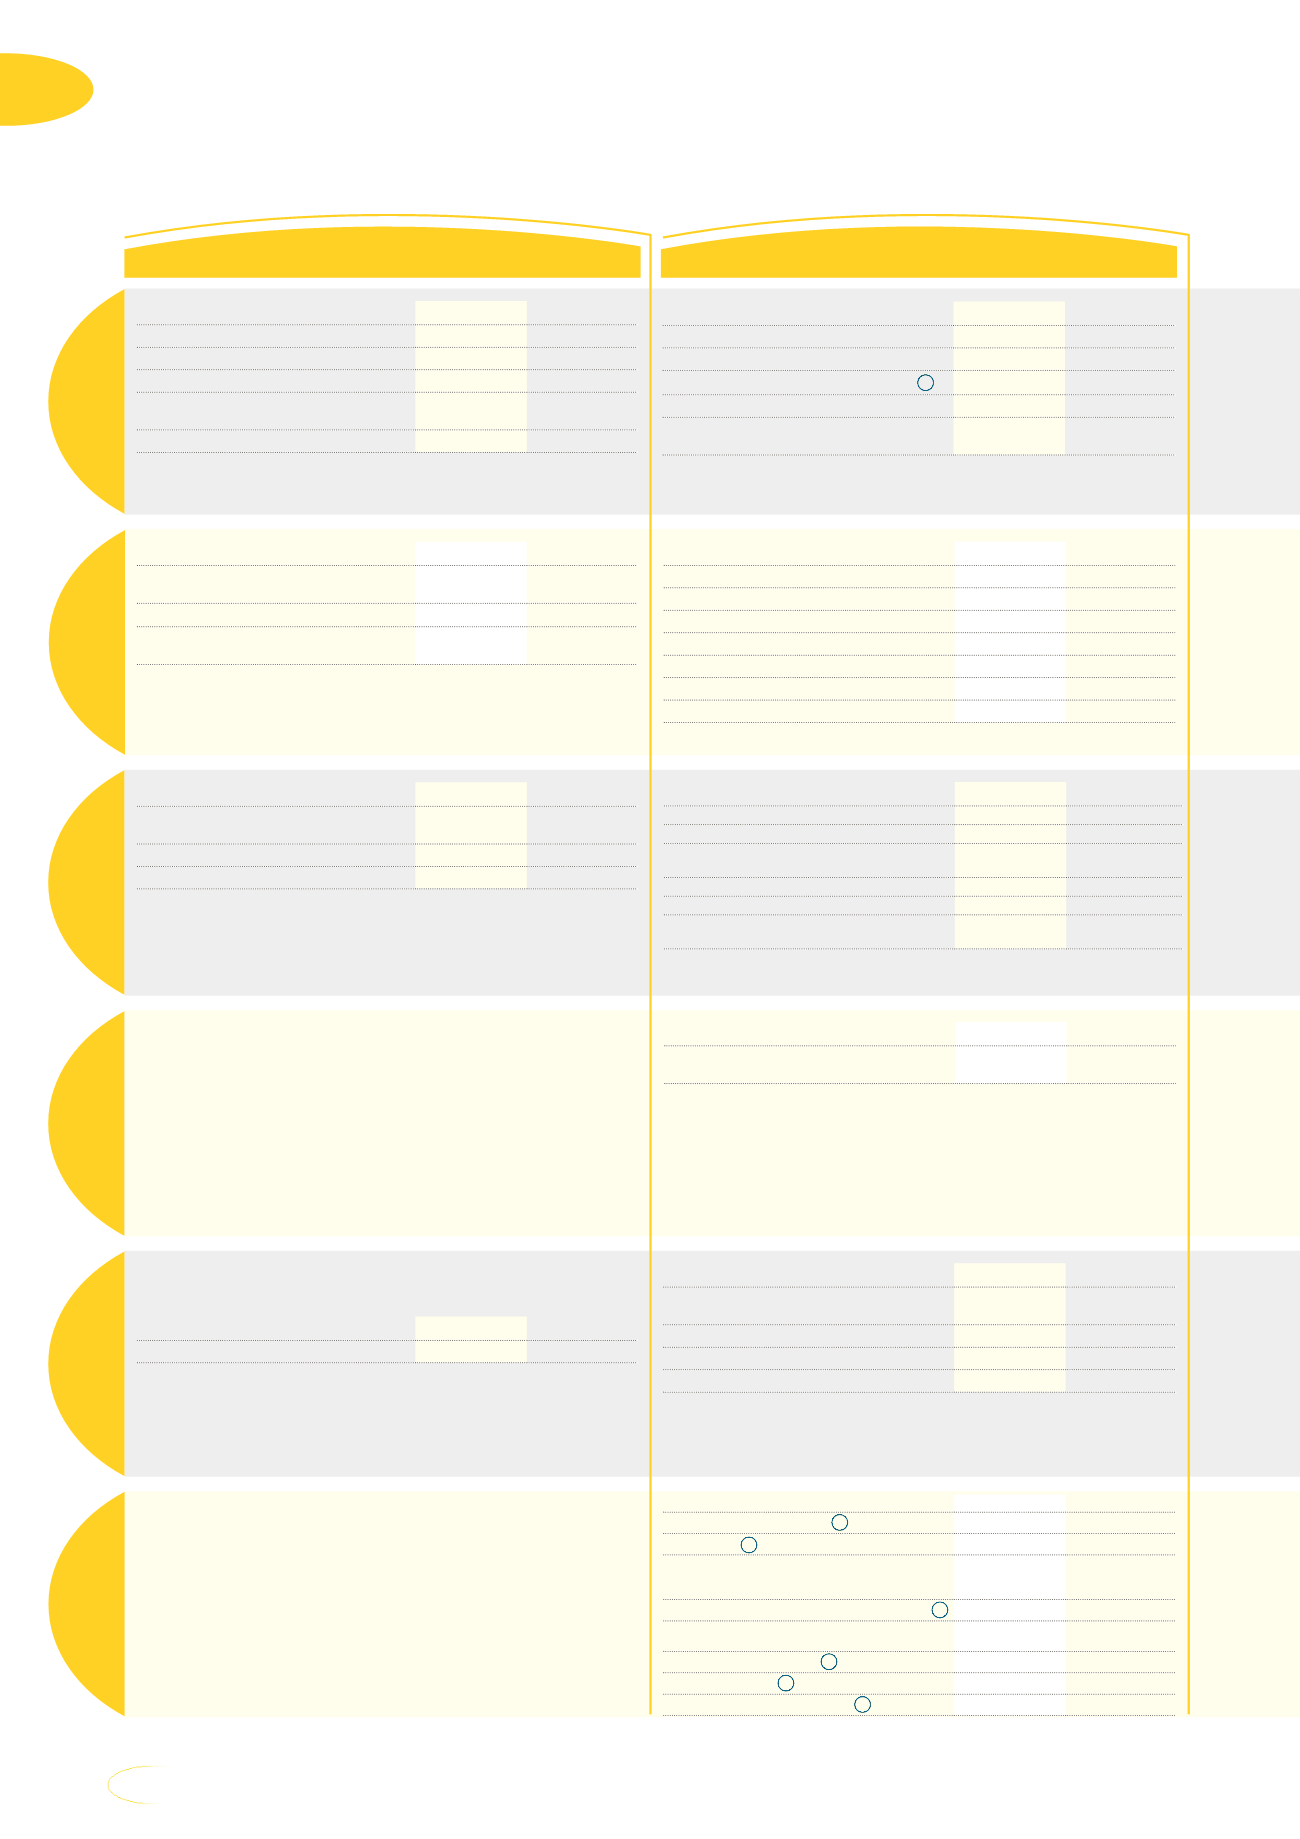
How we sustain value using the six capitals
•
Radio spectrum in the 700, 800, 900, 1 800, 2 100, 2 300,
2 600MHz bands.
2017
2016
Gigajoules of energy used
19 095 879
13 514 716
•
Constructive relationships with regulators, customers,
trade unions, employees, communities, civil society.
•
Ongoing interactions with government and tax
authorities.
•
Regular engagement with shareholders and the investor
community on MTN’s plans and performance.
Human
capital
Manufactured
capital
Financial
capital
Intellectual
capital
Natural
capital
Social
and relationship
capital
•
Our strong and established brand.
•
Our skilled and experienced employees.
•
Our partnerships and joint ventures.
•
More than 20 years’ experience of operating
in challenging emerging markets.
Key capital inputs
Outcomes of our activities
** Reported – as reflected in the MTN Group Limited financial results for the year ended 31 December 2017.
^ Excluding the Nigerian regulatory fine.
† Under amended ICT Sector Codes. Level 2 achieved in 2016 is now equivalent to Level 6 under new framework.
2017
2016
Number of employees
15 901
15 980
Number of contractors
3 030
4 009
Gender split (men:women)
63:37
63:37
Investment in employee training
(R million)
252
392
Number of nationalities employed
63
60
2017
2016
Staff costs (R billion)
9,0
9,2
Voluntary staff turnover (%)
7,0
7,2
Mean employee culture survey (%)
LA
70
67
Number of training courses completed
31 118
25 376
Opcos with Global Investor in People
accreditation (see page 81 for details)
17
16
2017
2016
Value of property, plant and
equipment (R billion)
91,8
**
95,6**
Capital expenditure (R billion)
31,5
**
35,3**
Number of smartphones on our
networks (000)
88 506
82 361
•
Offices and networks in 24 countries.
•
Access to public infrastructure.
2017
2016
2G sites rolled out
3 663
2 450
3G sites rolled out
8 583
8 201
4G sites rolled out
8 611
7 676
Kilometres of fibre rolled out
4 364
5 481
Depreciation (R billion)
19,3
**
21,0**
Impairment of assets (R billion)
3,0
**
0,2**
Impairment of goodwill (R billion)
2,6
**
0,9**
2017
2016
Market capitalisation (R billion)
at year-end
257
238
Interest received (R billion)
3,5
**
4,4**
Net debt (R billion)
57,1
**
51,9**
2017
2016
EBITDA (R billion)
47,0
**
40,8**
Profit/(loss) after tax (R billion)
4,5
**
(3,1)**
Cash generated through operations
(R billion)
38,5
**
55,7**
Net debt to EBITDA ratio^
1,22
1,27
Net interest paid (R billion)
3,9
**
3,7**
Basic headline earnings/(loss) per
share (cents)
182
(77)**
2017
2016
Total tax contributions
LA
(R billion)
27,9
33,5
‡
CSI spend
LA
(R million)
172
295,4
BBBEE status in South Africa
†
Level 4
(102.65
points)
Level 2
(87.83
points)
Number of calls to whistle-blower line
LA
119
120
MTN Mobile Money active subscribers
(million)
21,8
15,4
NPS South Africa (%)
LA
Δ
70
81
NPS Nigeria (%)
LA
Δ
26
30
NPS other key markets (%)
LA
35
25
2017
2016
Carbon emissions (tonnes of
CO
2
equivalent)
◊
2 006 248
1 609 704
GHG emissions avoided (tonnes)
1 529
833
Number of new alternative energy sites •
459
1 001
E-waste recycled (tonnes)
215
537
2017
2016
Goodwill and intangible assets
(R billion)
38,3
**
46,5
**
•
MTN South Africa named most valuable brand in the
country (Brand South Africa).
•
Introduced standardised CVM platforms across 18 opcos.
•
Expanded MTN Mobile Money ecosystems to 14 markets.
•
Launched customised offers in 10 opcos.
14
MTN Group Limited
Integrated Report 2017