


 6 / 108

Our market context
The environment in which we operate has direct implications for our ability
to create value, informing our BRIGHT strategy and our investment case. By
considering our market context, we are better able to determine our material
matters and how best to respond to them.
Political and economic environment
•
•
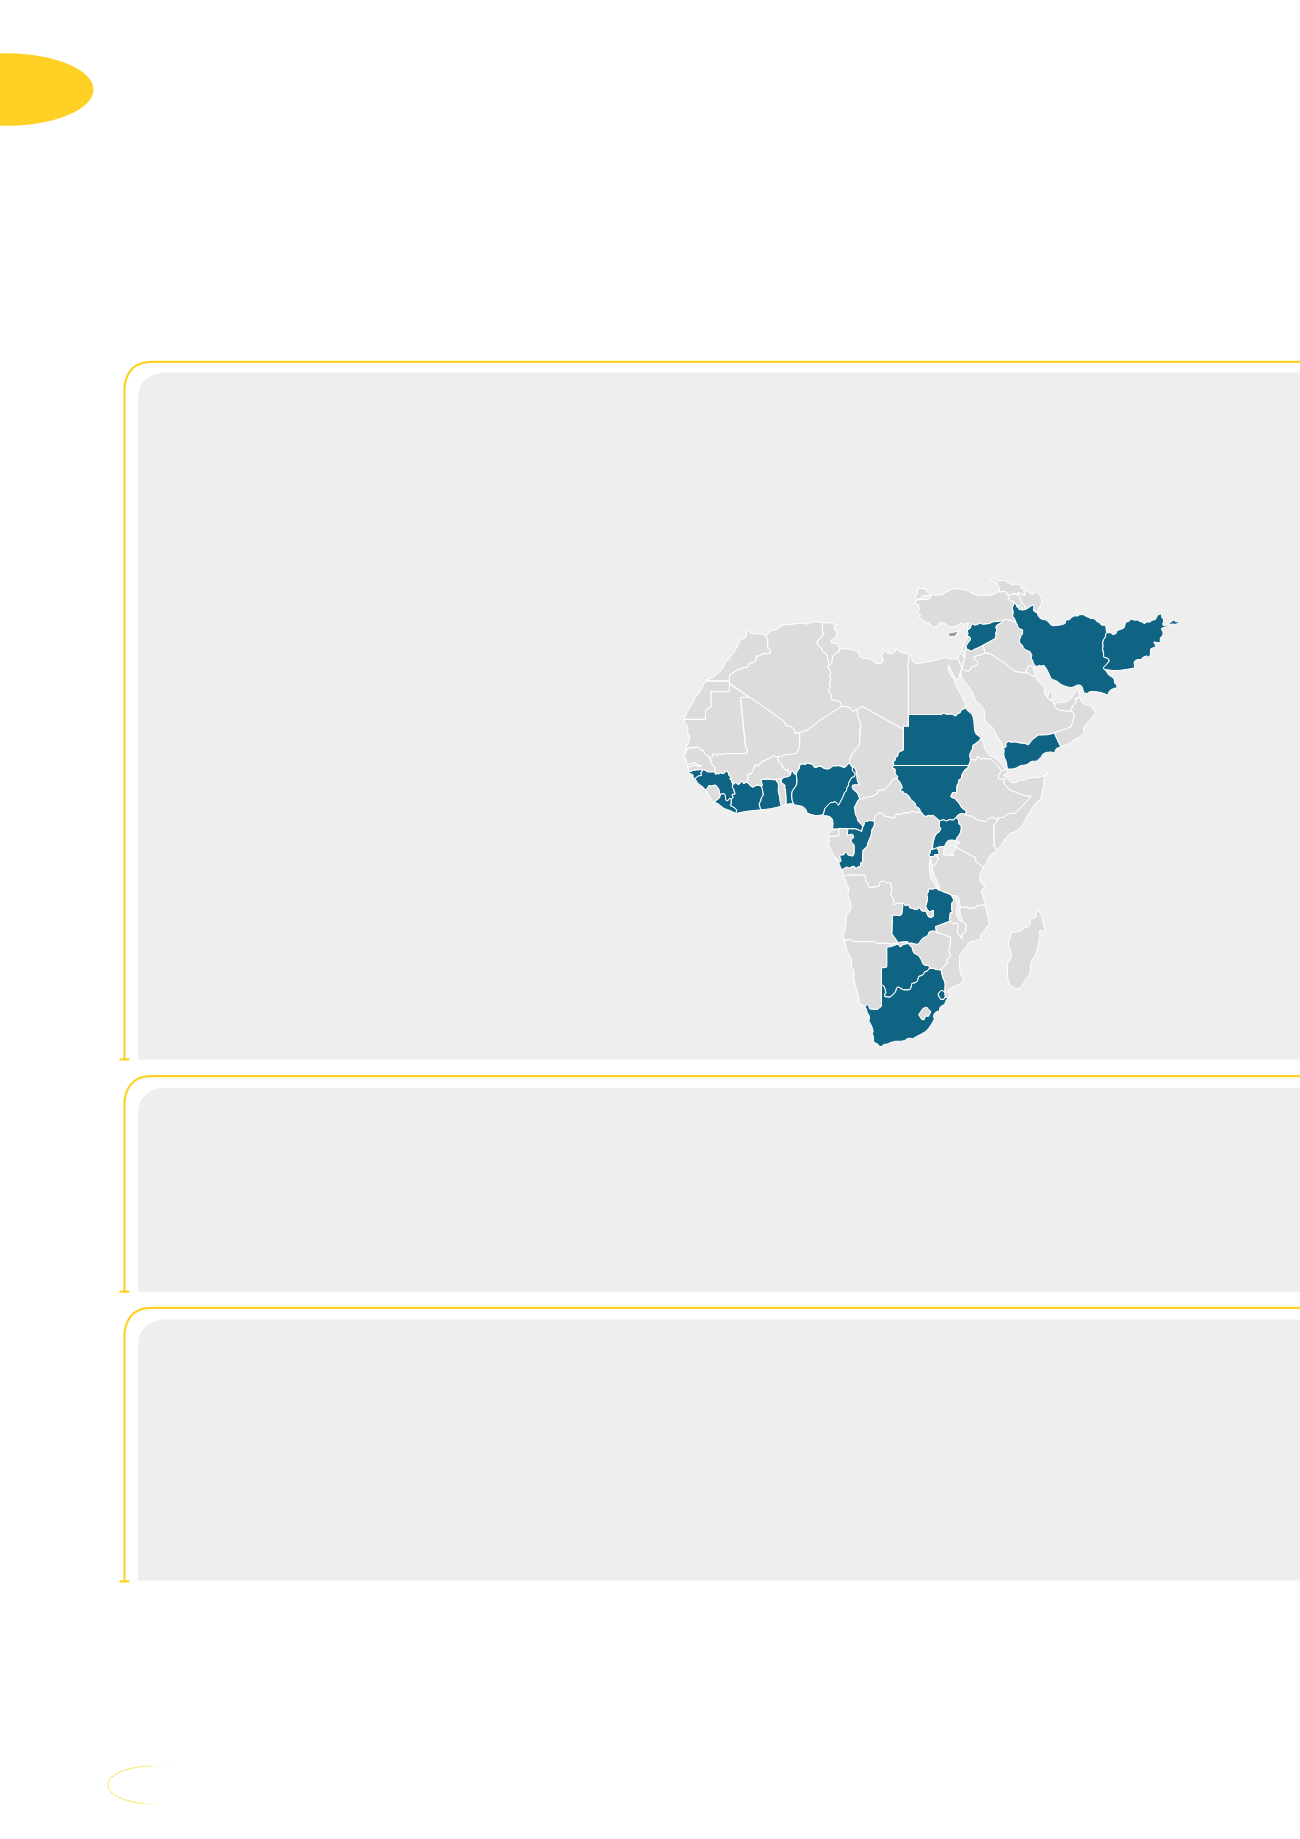
Prolonged war and conflicts impact
Syria, Yemen, Afghanistan and South Sudan.
•
•
Elections planned for 2019 in
South Africa and Nigeria.
•
•
Iran
remains in focus because of the threat of sanctions from the new US Administration.
•
•
Across our footprint,
government interventions are increasing and the regulatory environment
is complex but governments are focused on increasing connectivity and digitising societies.
•
•
Global economic growth
picking up, but with strong
divergence between countries.
•
•
Africa
forecast to be world’s
second
fastest growth region to 2020.
•
•
Currency volatility
across our main markets.
•
•
Inflationary pressure
in Nigeria,
Ghana and Iran.
•
•
Growing income
and
purchasing
power
in our markets.
•
•
Economies
becoming
increasingly formalised,
improving ease of operation.
Social context
•
•
Young and growing population
across our markets.
•
•
Africa urbanising faster
than any other region.
•
•
Unemployment remains high.
•
•
Financial inclusion
will be key to unlocking consumption.
Technology environment
•
•
Low internet adoption.
•
•
Digital connectivity to increase fourfold,
with broadband penetration growing from 21%
in 2015 to 80% in 2020.
•
•
Exponential data traffic growth.
•
•
MTN Mobile Money ecosystems established
in 14 markets.
•
•
3G and 4G network expansion
across all markets.
1
Population across MTN markets.
2
Private consumption per capita is real private consumption at purchasing power parity rates with 2005 base year divided by population for all
of MTN’s markets except South Sudan (no data available).
3
MTN market size estimates. Source: IHS World Market Monitor; EIU; WCIS; OVUM; Delta Partners analysis; Kable analysis; MTN analysis.
4
Weighted average of inflation across MTN Group markets using markets’ GDP contribution as base.
04
MTN Group Limited
Integrated Report 2017