


 15 / 108

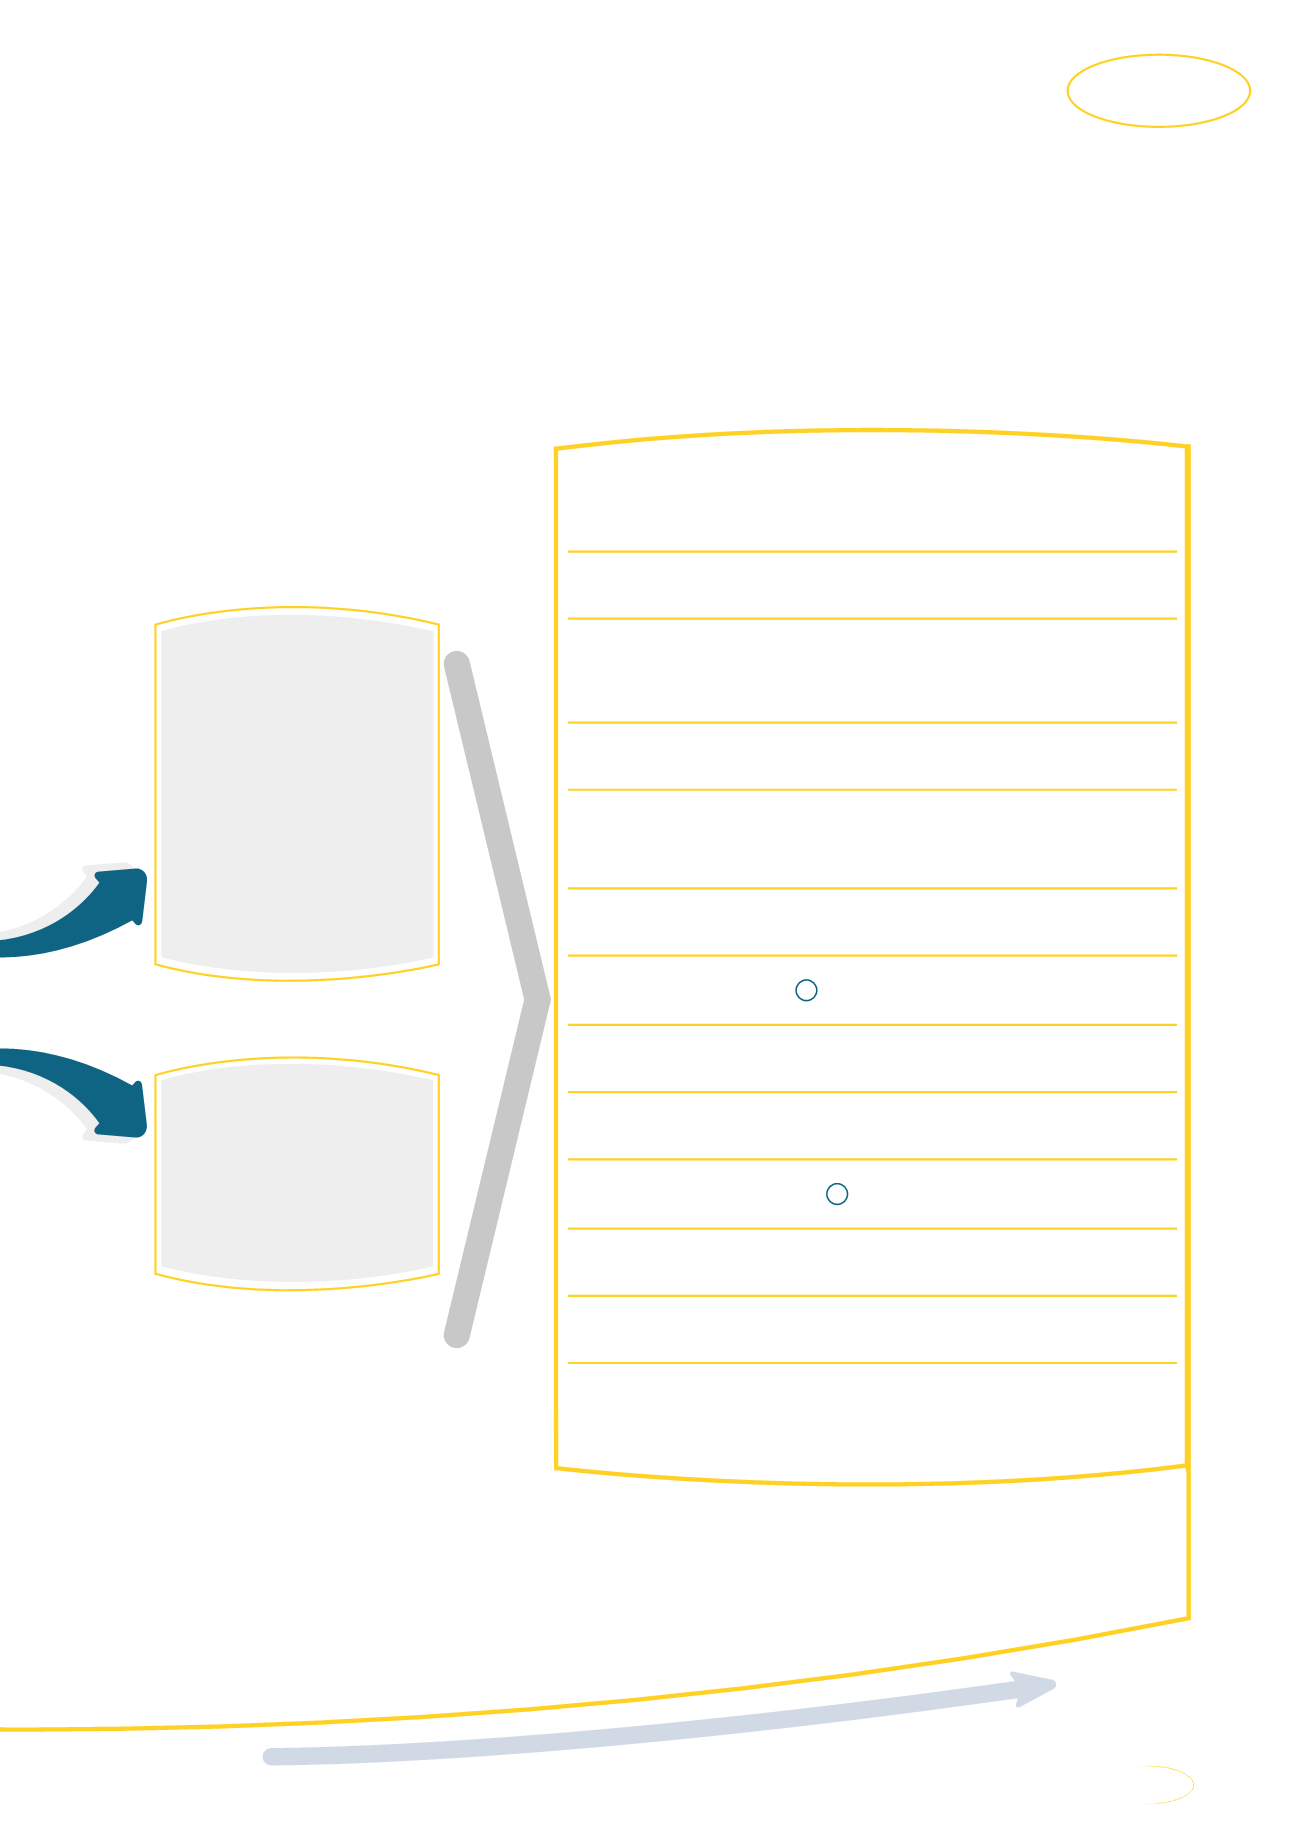
We require inputs of each capital to deliver on our strategy, advance some
of the UN Sustainable Development Goals (SDGs) and generate value for all
stakeholders. When making decisions on allocating capital, we consider the trade-
offs between the capitals, and seek to maximise positive outcomes and curb
negative impacts.
Outcomes in 2017
#
Defined as an output by the llRC.
^
Under amended codes, which have significantly higher recognition levels.
Outputs
18 931
employment opportunities
in 24 countries
R9,0 billion paid in
wages and salaries
Rolled out
3 663 2G, 8 583 3G
and
8 611 LTE sites
EBITDA
of R47,0 billion**
Declared
total dividend
of 700 cents
per share
R31,5 billion** in
capital expenditure
Paid R27,9 billion
LA
in total
tax contributions
Paid R367 million in
regulatory fees
Avoided
1 529 tonnes of
GHG emissions
Spent R172 million
LA
in
social investment
Improved
employee culture
Improved
NPS
in most markets
MTN South Africa BEE
contributor status
at
level 4
^
A range of consumer,
enterprise and
wholesale solutions
including voice
and data access;
lifestyle, mobile
financial services,
entertainment and
e-commerce offerings;
and business
connectivity and
communication
solutions
2 006 248 tonnes
of greenhouse
gas emissions
#
C
R
E
A
T
I
O
N
MTN Group Limited
Integrated Report 2017
13
How we create value