Our people and their remuneration
Remuneration committee chairman’s report
It is my pleasure to present our people and their
remuneration report for 2015. This year, we have
included a section on our people as part of the
remuneration report to provide more detail on how
we manage our people and the context for the
remuneration decisions we took given some of the
challenges we faced in the year.
Review of 2015
In 2015, the remuneration committee felt the impact
of the challenging operating environment across our
markets. A key challenge in the year was the
industrial strike action in MTN South Africa related to
employees not receiving bonuses as a result of the
operation not meeting its bonus criteria for the 2014
financial year.
Unfavourable economic conditions, continued price
competition, a tough regulatory environment and a
rapidly evolving sector required a comprehensive
review of our people management. The key initiatives
taken in light of these challenges in 2015 included:
- A reduction in the pool of funds for incentive
schemes as a result of lower returns from our
investments coupled with cost pressures;
- For the first time, most of our operations did not
meet their minimum financial targets resulting in no
incentives being paid;
- A review of compliance and regulatory
requirements across our operations; and
- Impactful, transparent and simplified engagements
with various stakeholders including employees,
governments and social partners.
Despite these challenges, we achieved a moderate
year-on-year improvement in people management
indicators including voluntary staff turnover rates,
engagement scores, and positive signs of culture
change. We also made progress in the development
and investment commitments to our talent. To drive
accountability at key managerial levels, we reviewed
our performance management rules to better align
the setting and measurement of performance with
the corresponding reward to include other levels
below the executive line.
Delivering on our new digital plans required revised
governance and we made a number of executive
appointments to enable optimum governance across
our operations.
Outlook for 2016
We expect to feel the impact of decisions taken in
the year in 2016 and the years ahead. Some of the
planned initiatives which will redefine how we work,
where we work, and – more importantly – how we
drive productivity, incentivise employees and boost
staff morale include:
- Reviewing our incentives for robustness to foster
higher performance and filter poor performance
through the appropriate exit channels;
- We will continue to emphasise to our entire
workforce the importance of customer service
delivery as a non‑negotiable expectation in all
customer dealings;
- We will look into alternative sourcing tactics to
bolster our talent pipeline with those skills
necessary to execute business strategy;
- Effective cost-saving measures will remain a
priority; and
- We will engage in regular and honest
communication with our people on pertinent
business topics, including regular company
performance updates, incentive model reviews,
and regulatory changes, and a holistic employee
value proposition for talent attraction and retention.
Critical to our success will be to keep employee
morale high in 2016 and beyond, while we transform
our operating model. As we execute on our 2016
people plans, the wellbeing of our employees will
remain critical.
I wish to thank all executives, the management team
and all employees for their efforts during a
challenging year.
Alan Harper
2 March 2016 |
Our people
At MTN we believe that the investment we make in
our people is fundamental to achieving our strategy
and improving our competitive edge. Employee
engagement and development is essential to ensure
that we deliver the best customer experience and
increase our business performance.
2015 was a challenging year for MTN with regards to
people. The year began with the continuation of the
Ebola outbreak in West Africa and the civil strife
across the Middle East. The strike at MTN South
Africa and the changes in leadership following the
imposition of the fine on MTN Nigeria caused further
people challenges that required us to respond
quickly and effectively to ensure that our people
remained engaged and focused on our strategy.
Revised Group operating structure
and key leadership changes
Following the fine in Nigeria, we reviewed the Group’s
operating structure with a view to strengthening
operational oversight, leadership, governance and
regulatory compliance across our 22 country
operations in Africa and the Middle East. To this end,
we re-implemented our previous reporting structure,
effective 1 January 2016. The key changes to the
Group operating structure is on  10.
Overview of our people
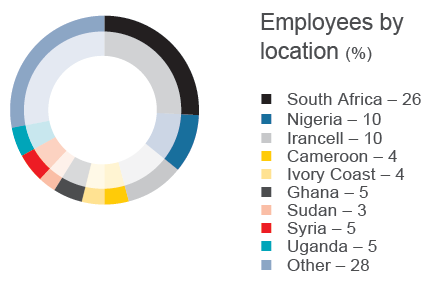
At the end of December 2015, MTN employed
15 202 permanent employees and a total of
5 882 contractors. The number of people in the
business declined 5% from 2014, mainly due to
ongoing initiatives to simplify the business. Below is
a summary of our key people indicators:
Engagement and culture
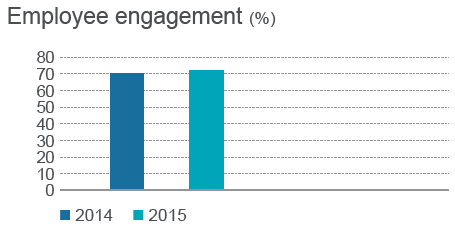
Achieving high levels of employee engagement and
fostering the right culture is fundamental to achieving
our strategic imperatives. Every year we invite staff
to participate in our global culture audit survey in
order to measure our employee engagement and
culture across 15 people dimensions.
Our sustainable engagement score improved by
two points from 2014 to a score of 72. The
improvement depicts the combined efforts of staff
and management to prioritise the people agenda
amidst the challenging operating environment.
MTN South Africa’s engagement increased by
one point from 2014, the initial sign of the rebuilding
of staff engagement activities following the strike in
mid-2014.
Our ongoing culture operating system (COS)
programme to instil the MTN vital behaviours also
increased by two points from 2014 after a decline in
2013. The vital behaviours are the foundation of our
social engine in order to ensure that our people work
in a way that is commensurate with the Company’s
values of integrity, honesty and innovation.
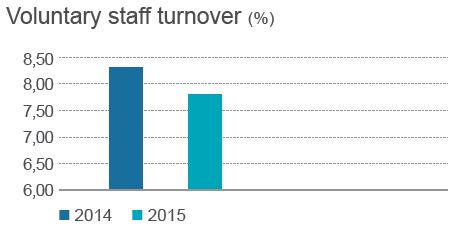
Our employee voluntary turnover rate, which
measures the rate at which employees voluntarily
exit MTN, decreased from 8,3% in 2014 to 7,8% in
2015. Retaining our top talent was a key focus for
2015 and yielded positive results, with the voluntary
turnover rate of high performers at 5,5%.
A diverse African and Middle Eastern company
Key to ensuring customer centricity is a diverse
workforce that understands the varied needs of our
subscribers. By the end of December 2015, MTN
employed over 59 different nationalities.
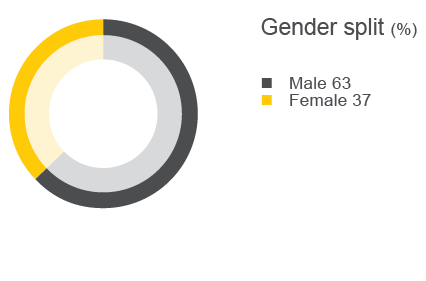
Gender diversity is also a key metric. By the end of
December 2015, 37% of staff were female and 63%
were male. With regard to management positions,
27% of managers were female and 73% were male.
Our focus is to improve our gender diversity in
important leadership positions and during 2015 we
employed women in the following key posts:
- Jyoti Desai – Group chief operating officer; and
- Philisiwe Sibiya – CEO of MTN Cameroon.
Building an organisation for
the future
During 2015, we continued our organisational
transformation to achieve our vision. We continued to
streamline our back-office operations through the
expansion of our shared services models while
building the pillars for future growth. In 2015, we
continued to embed the structure for our enterprise
business unit and introduced a new operating model
for digital services.
In addition, we developed a strategic workforce plan
to identify the skills required over the next three
years to achieve our strategy, as well as the gaps. We focused on closing the gaps relating to digital,
commercial and technical skills required for the
future. During the course of the year, 40% of the
gaps were closed:
- 41% were external appointments, of which 20%
were from telecommunications competitors,
31% from ICT organisations, 11% from FMCG
organisations, 6% from financial services
organisations and 32% from other; and
- 59% were internal placements of which 25% were
from talent succession pools.
Talent and learning
MTN provides talent management and learning
solutions through the Global Talent and Learning
Centre of Excellence. In order to ensure that we
continue to attract, retain and build the best talent,
we introduced two key initiatives to strengthen our
talent pools during 2015:
- Global talent standards were introduced to provide
the minimum technical and behavioural
requirements for each position and level of work
within the organisation. The standard is
complemented by a battery of psychometric
assessments to ensure a suitable cultural fit based
on the seniority of leadership.
- To supplement the global talent standards, talent
development standards (TDS) were defined to
clearly articulate the learning and development
priorities per functional area within the business.
The defined TDS align with career goals and
inform promotion/succession decisions across
segments and functions.
Our 2015 talent review cycle was successfully
concluded based on the above revisions and we
remain stable at a succession bench strength of 2:1
(two successors for every one incumbent) for
leadership positions across the Group.
From a training perspective, the expenditure on
training activities declined from 2014 mainly due to
operating expenditure pressures. Nonetheless,
13 240 people were trained across 889 unique
courses across the Group. In order to ensure that the
key business priorities are catered for in 2016,
we undertook the following key learning and
development initiatives:
- We completed a new pilot for customer service
behaviours for rollout in 2016. In addition, core
customer experience training continued across
the opcos;
- We rolled out enterprise business sales training to
208 sales staff;
- We completed social media training of all required
staff, which had been launched in 2014; and
- We launched a pilot programme for a Digital BSc
Honours degree focusing on technology, design
and innovation. The initial group of 12 individuals
completed the course.
People performance management
We successfully completed our 2015 integrated
performance cycle ensuring that our pay-for-performance
framework is cascaded throughout
the organisation. In addition, we enhanced our
performance framework for lower level staff and
introduced additional mechanisms to align goals for
management. The improvements to the framework
were positively received and resulted in a two-point
increase in the performance management dimension
of our Group culture audit.
Best practices
The Global Investor in People (IiP) standard is a
people management best practice accreditation
that defines what it takes to lead, support and
manage people well for sustainable results.
As at December 2015, a total of 15 MTN operating
companies had achieved varying levels of
accreditation, up from 12 in 2014. It is important to
note that MTN Cameroon, MTN Ghana, MTN’s head
office and MTN Nigeria all achieved gold
accreditation – the highest level of accreditation
available.
In further developing a culture of recognition, in
2015 MTN launched a new global social recognition
programme called “MTN Shine”. The platform
provides opportunities for leaders and staff to
recognise each other through the allocation of
recognition points (or a recognition wallet) which
can be redeemed as vouchers. The new platform
recorded over 100 000 recognition messages and
achieved the South African Rewards Association
(SARA) “project of the year” award.
Remuneration report
Our remuneration philosophy
MTN’s remuneration philosophy is part of our
interlinked, holistic people and talent approach,
aiming to support current and evolving business
priorities. The philosophy aims to attract, motivate
and retain desired talent to execute business
strategy in a sustainable manner over the longer
term. Given the competitive talent landscape,
this philosophy is underpinned by the following
key objectives:
- Presenting a competitive yet affordable reward
proposition;
- Fairly differentiating pay by relevant performance
indicators; and
- Presenting a flexible and fully compliant reward
system.
In our efforts to achieve the optimal attraction,
retention and motivation of talent, we apply various
approaches, including the following:
For competitiveness and affordability
- Market benchmarking of reward components on a
regular basis.
- Linking both short-term and long-term incentives
to various performance indicators.
For differentiation and flexibility
- Establishing performance as the basis for
employee reward.
- Offering the ability to customise reward, taking
into account the varied needs and lifestyles of
employees.
For compliance and sustainability
- Continuously applying full regulatory and
legislative compliance in the various markets in
which we operate.
- Regularly auditing and assessing risks, benefits
and compliance of reward.
Our remuneration policy
Maintaining a competitive advantage over those
companies we source from and lose talent to, is
imperative. To achieve this, we regularly conduct
benchmarking exercises in order to design our pay
policy to target the market median at minimum.
We never deliver reward that is either:
- Below minimum legislative requirements; or
- Below our internally approved pay scales.
As an example, South African legislation establishes
that remuneration may not be less than a predefined
hourly sectoral minimum rate. We calculated this rate
to be a minimum average of R14,15 per hour. As at
December 2015, the lowest paid hourly rate for a
full-time employee was R34 per hour, higher than
the average legislated threshold.
Where applicable and depending on specific job
requirements, we provide opportunities for people to
progress through the pay scales over time based on
performance and individual factors weighted against
job requirements. Overall, employee packages differ
based on performance and job requirements
analysis against individual employee skills, including
job-related competencies, abilities and behaviours.
Our reward principles
In delivering on our remuneration policy, we apply
the principles of:
- Fair pay based on the value of the job relative to
other jobs of similar worth i.e. internal equity;
- Ongoing benchmarking to remain a competitive
offering to employees i.e. external equity;
- Performance-based culture for both our short-term
and long-term incentives;
- Transparent and simplified communication across
all levels including external stakeholders;
- Consistency across all our operating units,
however, acknowledging differentiation and
customisation;
- Empowerment of line managers to deliver effective
pay decisions;
- Flexibility, taking into account the diversity of our
employees across all our operating companies;
- Company affordability so as to support the
performance expectations of our shareholders;
- Optimal pay structure between fixed and variable
remuneration so as to drive the right focus both in
the long and short term;
- Values-based and output-driven recognition of
actions aligned to our vital behaviours; and
- Recognising entrepreneurship and innovativeness.
Our remuneration practices meet the minimum
related compliance requirements. For example,
against King III principles, our compliance scorecard
is as follows:
| King III principle |
|
|
Comply |
|
|
|
|
| Remuneration policies and practices
are aligned to company strategy and
linked to individual performance |
|
|
Yes |
|
|
|
|
| Policies address a fair mix of fixed to
variable remuneration |
|
|
Yes |
|
|
|
|
| Incentives are based on stretched
and verifiable targets related to both
financial and non-financial indicators |
|
|
Yes |
|
|
|
|
| Both long and short-term incentives
comprise more than one measure and
measures are fairly balanced |
|
|
Yes |
|
|
|
|
| There is no automatic entitlement of
incentive for both long and short-term
incentive plans |
|
|
Yes |
|
|
|
|
| There is no automatic entitlement to
bonus or share-based payments on
early termination of employment |
|
|
Yes |
|
|
|
|
| The value of incentives is significant
relative to base pay. Participation
in share schemes is limited to
management staff only |
|
|
Yes |
All strategic reward decisions are prepared and
guided by our executive management team for
approval by the remuneration and human resources
committee. This committee is delegated approval
authority at various levels with its roles and
responsibilities listed below.
The remuneration and human
resources committee
MTN’s remuneration and human resources (R&HR)
committee is delegated responsibility by the board
of directors to make sound remuneration decisions
that are aligned with the Company’s strategy and
acceptable governance principles.
In executing its duties, the committee consults
external experts as and when necessary, although
the committee makes the final decision with regard
to the interests of stakeholders. The committee
ensures that:
- Effective governance structures are implemented
within the remuneration framework, supported by
a strong and fully compliant reward system;
- Adequate and sound risk controls are implemented
across the Group to mitigate any potentially
negative remuneration exposure;
- The pay structures for executive members and
that of all other employees are aligned with the
market and internal pay policies, taking into
account the availability of skills in the market as
well as executive competency levels; and
- The Company’s pay-for-performance objective is
effective and justified in accordance with set
performance criteria.
The committee constantly reviews the remuneration
strategy to ensure that its policies and principles
remain applicable to the dynamics of the business
and in accordance with legislative stipulations.
Full details of the committee’s terms of reference
and key focus for the year under review are outlined
in the corporate governance report on 47.
Our remuneration structure
Although MTN applies a fixed remuneration package
approach across its operations, variations exist
where we adopt the “base plus benefits” approach
due to local market conditions. The fixed remuneration
approach includes cash and benefits in kind which,
when combined with incentive payments and other
non-quantifiable elements, make up what we term
“Total Reward”.
Our fixed-pay component reflects general worth of
skills compared against job worth, while incentive
payments are based on short and long-term
performance.
| Fixed pay |
+ |
Benefit
programmes |
+ |
Short-term incentives
(STIs) |
+ |
Long-term
incentives (LTIs) |
+ |
Recognition |
+ |
Other |
|
|
|
|
|
|
|
|
|
|
|
|
|
|
|
|
| Annual fixed package^ |
|
|
Performance-based incentives |
|
|
|
|
|
|
|
|
|
|
|
|
|
|
|
|
|
|
|
|
|
|
Fixed basic
salary delivered
on a monthly
basis.
Based on scope
and nature of the
role and
generally
determined
around the
market median,
but can expand
or contract
based on market
dynamics and
business goals.
Reviewed on an
annual basis
and, where
applicable,
benchmarked
on an off-cycle
basis to ensure
competitiveness
and relevance. |
|
|
Company provided
benefits
delivered on a
monthly basis.
Provides
economic
security for
employees and
act as an
incentive to
attract and retain
skills.
Contractually
agreed and will
differ across
operations.
Commonly
include
retirement,
health, death
and disability
insurance. |
|
|
Variable Company- provided
incentives
aligned with the
short-term goals of
the Company,
delivered on an
annual basis.
Performances up
to one year are
assessed and
rewarded for
achieving minimum,
stretch-target and
above-target
performances.
Aligns with financial
and strategic key
performance.
Individual, team and
Company
performance is taken
into consideration,
with executive
performance
weighted towards
Company
performance.
At an operational
level, certain sales
positions participate
in a commission-based
incentive
scheme. |
|
|
Variable
incentives in the
form of share
allocations. The
allocation of
shares is meant
to drive
long-term
sustainability and
performance of
the Group.
Potential
payments are
attributed to the
financial
performance of
the Company.
Share incentive
payments make
up a larger
portion of total
executive
remuneration
relative to
short-term and
fixed pay. |
|
|
Formal and informal platform designed to drive recognition between employees and departments, both within and across MTN’s operations |
|
|
MTN offers
other benefits.
These include
lifestyle
benefits, leave
of absence,
and additional
insurance
products.
Although some
of these
benefits are not
prevalent in all
operations,
there are
country-specific
programmes
approved and
aligned with
equivalent
South African
benefits. |
| ^ |
Please note the term “fixed package” as used should not promote a sense of entitlement or non-adjustability of the package, should MTN deem this appropriate. The term,
however, must be defined within the context and used synonymously with “annual fixed package”, meaning that certain benefits such as contribution arrangements to
medical aid, although fixed annually, may be adjusted as and when the Company needs to. |
Annual fixed package
Local employees
Generally, employees based in South Africa are
remunerated on an annual fixed package (AFP)
approach, which includes a combination of base
remuneration and benefit provisions, commonly
referred to as fixed remuneration. The Group has
implemented this approach subject to labour
regulations and remuneration practices. Non-South
Africa-based operations have adopted and
customised this approach in accordance with local
practices and regulations.
Expatriate employees
MTN deploys international talent (expatriates)
among our operations where this is of value and as
part of our talent mobility efforts. Although expatriate
employees are employed on a full-time basis and
with access to other benefits provided to local
employees, their contracts are, however, limited to a
fixed duration, typically two years.
In line with the frequency of talent mobility across
operations, during 2015, we reviewed the expatriate
pay model to introduce a greater degree of relative
internal pay equity across the various operations.
The choice of the United Arab Emirates as the global
employment company for the purpose of expatriate
compensation management allows us to standardise
expatriate base-pay levels in all countries within one
pay structure in a global reserve/hard currency. This
base-pay foundation is consistent for all assignees
with only country-specific dynamics being added
on, resulting in an MTN framework which represents
a balance between relative equity across the Group,
and local relevance.
MTN continues to prefer the employment of local
talent in operating companies. Notwithstanding the
above base-pay structure, the standardisation and
optimisation process for expatriate benefits remains
a priority. Where possible, within regulatory
requirements, MTN continues to standardise
expatriate employment contract conditions with the
goal of adopting one framework across operations.
This initiative is a gradual process due to legislation.
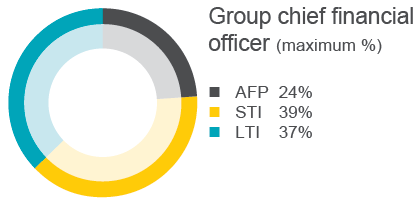
Executive pay composition
Executives are remunerated in line with short-term
and long-term business objectives using an optimal
mix of fixed pay, short-term and long-term incentives.
This supports the alignment of strategy and desired
individual behaviour. The mix is aimed at ensuring
that executives proportionately achieve an optimal
balance of remuneration when executing their
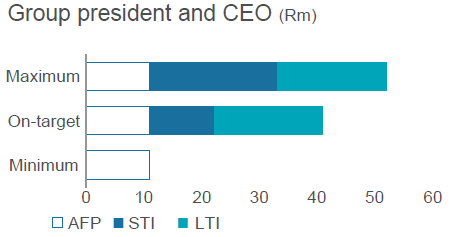
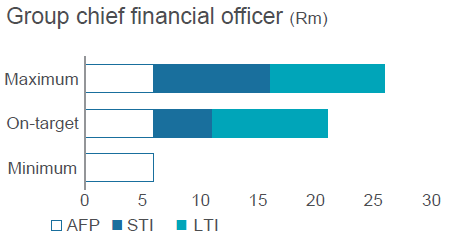
duties. The following graphs illustrate the mix of
minimum, on-target and potential maximum
compensation for the two director positions: group
president and CEO, and the group chief financial
officer.
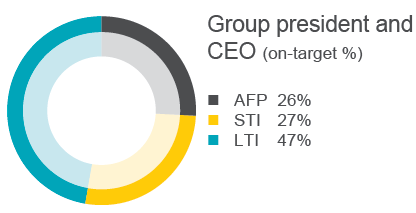
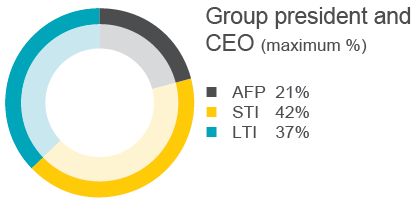
As illustrated above, the proportion of fixed to performance-based incentives varies between the Group
president and CEO and the Group CFO. Both roles comprise a higher weighting on performance incentives
“risk pay” and less on fixed package. While the fixed package does not vary based on individual performance,
the variable portion does. The Group’s integrated performance framework (IPF) guides the execution of
business strategy by providing a framework through which the day-to-day and annual performance levels are
set, cascaded and measured according to the business’s strategic themes. The IPF outcomes are translated
into incentive payments under the performance bonus plan.
Performance-based incentives
We provide different incentives to employees to reward performance on a short-term and long-term basis:
| Incentive category |
|
|
Purpose |
|
|
Incentive plan |
|
|
|
|
|
|
|
| • Short-Term Incentives
(“STI” schemes) |
|
|
• To reward the achievement
of set goals up to one year |
|
|
• Performance bonus plan (bonus plan)
• Sales commission plan (commission scheme) |
|
|
|
|
|
|
|
| • Long-Term Incentives
(“LTI” schemes) |
|
|
• To reward the achievement
of set goals in the long run |
|
|
• Share Appreciation Rights Scheme (SARS)1
• Share Rights Plan (SRP)1
• Performance Share Plan (PSP)
• Notional Share Option Scheme (NSO)
• Employee Share Ownership Plan (ESOP)2 |
|
|
|
|
|
|
|
1 Both the SARS and SRP are active but no longer issuing new awards. They were substituted with the PSP.
2 Once-off award of 400 shares made in 2010 to lower level employees under the Broad Based Employee Equity Scheme (BBEE). |
Short-term incentives
Annual performance bonus
General staff and executives participate in an annual
performance-based bonus plan. The principles of
the bonus plan are aligned with the performance
achievements of the Company, teams as well as
individual priorities.
Company priorities are derived from the yearly
business plan and budgets. The business plan and
budgets are aligned with the Group’s strategic
themes which get delegated to the members of the
executive team responsible for driving, supporting
and facilitating execution of priorities.
Details of the Group’s strategic priorities are on
23. The strategic analysis section on 28 provides executive responsibilities and how each
executive performed against strategic priorities
assigned to them.
Assigned priorities are further cascaded into
functional teams and individual key performance
indicators (KPIs). These KPIs are contracted and
agreed at the beginning of the year, and measured
at the end of it.
The resultant performance score of the Company,
team and individual contracts is used as an input
factor when calculating bonuses for employees.
Selected KPIs measured are set out on 28.
The process of determining the incentive award
pools from which performance bonuses are paid is
illustrated on the following page.
Description of performance criteria
| 1 |
|
Company performance (CP)
| • |
MTN Group: attributable earnings |
| • |
Opco: revenue, cash flow, EBITDA |
|
|
| • |
The financial performance targets of the Company
are determined in accordance with the five
strategic themes at the beginning of the year. |
| • |
A factual findings engagement is performed on
these results by an independent body. |
| • |
The percentage performance achievement against
target is translated into a nominal performance linked
scale, adjusted to allow for maximum
earning potential. |
| • |
Group attributable earnings are used at Group
level and EBITDA, revenue and cash flow are
used at operational level to measure Company
performance. |
|
| |
|
|
|
| 2 |
|
Team performance (TP)
| • |
Strategic themes are translated into
priorities |
| • |
Team priorities are further cascaded down |
|
|
| • |
The strategic themes are translated into priorities
to be executed at executive member levels.
Details on strategic priorities are on page 23. |
| • |
Depending on the size of the function, and where
applicable, team performance scorecards are
further cascaded to below executive levels. |
| • |
Achievement of each KPI is proportionate and
weighted; however, cumulatively they add up to
100%. |
|
| |
|
|
|
| 3 |
|
Employee performance (EP)
| • |
Alignment of individual performance
contracts with the departmental targets |
| • |
Each KPI set within the IPF principles |
|
|
| • |
At the beginning of each financial period, every
employee enters into a contractual performance
agreement. |
| • |
The performance agreement stipulates the
performance expectations to be measured at
year-end. |
| • |
Performance agreements ensure alignment
between Company, team and individual levels. |
| • |
This is not applicable to executives. |
|
|
|
|
|
|
2015 performance bonus reviews
MTN’s operations faced many challenges during
2014 and this trend continued, and even accelerated
in 2015. Among these challenges were (i) fierce
competition from non-traditional telecommunications
operators, (ii) greater regulatory and compliance
requirements, (iii) industrial action, and various other
external factors related to social unrest and
economic volatility.
These challenges collectively resulted in many of
our operations not meeting the minimum performance
levels required for a bonus to be declared, and
resultantly, did not qualify for a performance bonus.
Among the operations which missed the qualifying
criteria for 2014 was MTN South Africa. In accordance
with the then bonus rules, a minimum 4% of annual
remuneration was paid to employees in lower levels.
However, employees were dissatisfied with the
payment. This led to a prolonged strike in South
Africa, based on the argument from union-affiliated
employees that the 4% payment was insufficient and
did not adequately recognise their contributions to
the business.
As part of our ongoing review commitments,
management reviewed the bonus rules. All revisions
led to extensive engagements with staff and social
partners.
As applicable to lower level employees at level 1 and
level 2, the following was approved:
Minimum guaranteed payment
- A guaranteed 4% of annual remuneration payment
in December, subject to approval of each opco
board. This payment was in lieu of shares which
level 1 and level 2 do not participate in.
- This payment was however conditional on minimum
individual performance as approved by the
respective boards.
Furthermore, management approved that for each
financial period, two computations would apply:
- Computation if the board declares bonuses based
of achievement of minimum Company performance
levels being met; and
- Computations if the board does not declare
bonuses, i.e. minimum Company performance
levels are not met.
These three scenarios are summarised as follows:
| Description |
|
|
Minimum 4% payment in
lieu of shares1 |
|
|
Requirements if a bonus is
declared by the board |
|
|
Requirements if a bonus is
not declared by the board |
|
|
|
|
|
|
|
|
|
|
| Individual performance
applies |
|
|
Yes, an individual
minimum performance
score is required |
|
|
Yes, an individual
minimum performance
score is required |
|
|
Yes, an individual
minimum performance
score is required |
|
|
|
|
|
|
|
|
|
|
| Earning range as a %
of applicable annual
salary |
|
|
Exactly 4% |
|
|
From 0% to 12% |
|
|
From 0% to 6% |
|
|
|
|
|
|
|
|
|
|
| Percentage payable at
target achievement |
|
|
Not applicable |
|
|
9% |
|
|
4,5% |
| 1 The 4% minimum was payable with effect from December 2015, subject to approval of each opco board. The changes as applicable to the performance bonus were effective
for the 2015 financial year. |
Where bonuses were paid, the following example
illustrates the calculation methodology:
| 1. |
Three elements are used as inputs to a bonus
calculation, namely company performance (CP),
team performance (TP) and employee
performance (EP). Each element has a weighting
(a), with all elements combined adding up to
100%. |
| 2. |
Targets for each element are set at the beginning
of the performance cycle and measured at
the end of the performance cycle where a
corresponding “nominal % (b)” is determined
from a standard translation table. |
| 3. |
Company performance as a “qualifier” for bonus
declaration is first assessed for each operation. |
| 4. |
For each weighted element, there is a job level
related on-target (c) and maximum (d) earning
potential. |
Upon assessment of Company performance by the
board, a bonus is either declared or not. If declared:
| Step 1: |
The weighting of each element (a) is
multiplied by the achieved nominal (b) and
the results of the three added together. |
| Step 2: |
Then the sum of the three is multiplied by
the on-target % (c) to derive the bonus
percentage. |
| Step 3: |
As a validation, a check is done against the
maximum % for each job. If the calculated
amount does not exceed the maximum, the
final bonus percentage is multiplied by
annual incentive salary to arrive at the final
bonus payment. |
| |
(CP + TP + EP) x on-target percentage = bonus percentage |
|
| |
The bonus percentage (validated against the minimum
and maximum) x annual salary
= total bonus payable |
|
|
Case studies for three levels at Group
At the beginning of the year, the Group’s attributable earnings (GAE) target for calculating bonuses at the end
of the year was R10 billion. For bonus purposes, a 90% minimum achievement of R9 billion was required, and
a maximum of R12 billion applicable. Using the following assumptions, the bonuses for the three employee
levels: executive director, senior manager and employee level 2 will be as follows:
| Assumptions |
|
|
Executive
director |
|
|
Senior manager
employee |
|
|
General staff
level 2
(bonus declared) |
|
|
General staff
level 2
(bonus not
declared) |
|
|
|
|
|
|
|
|
|
|
|
|
|
| Annual salary |
|
|
R2 000 000 |
|
|
R1 000 000 |
|
|
R400 000 |
|
|
R400 000 |
|
|
|
|
|
|
|
|
|
|
|
|
|
Bonus elements
|
|
|
100% (50%
weighting)
75%(2a) (50%
weighting)
Not applicable |
|
|
100% (20%
weighting)
100%(2b) (50%
weighting)
150%(3a) (30%
weighting) |
|
|
Not applicable
100%(2b) (50%
weighting)
133%(3b) (50%
weightin) |
|
|
Not applicable
100%(2b) (50%
weighting)
133%(3b) (50%
weighting |
|
|
|
|
|
|
|
|
|
|
|
|
|
| On-target bonus (%) |
|
|
80% |
|
|
20% |
|
|
9% |
|
|
4,5% |
|
|
|
|
|
|
|
|
|
|
|
|
|
| Maximum bonus (%) |
|
|
160% |
|
|
30% |
|
|
12% |
|
|
6% |
|
|
|
|
|
|
|
|
|
|
|
|
|
| Calculation formula |
|
|
(100% x 50%)
plus
(75% x 50%)
plus
zero
equals 87,5% |
|
|
(100% x 20%)
plus
(100% x 50%)
plus
(150% x 30%)
equals 115% |
|
|
Zero plus
(100% x 50%)
plus
(133% x 50%)
equals 66,5% |
|
|
Zero plus
(100% x 50%)
plus
(133% x 50%)
equals 66,5% |
|
|
|
|
|
|
|
|
|
|
|
|
|
| Final bonus (%)4 |
|
|
87,5% x 80%
equals 70% |
|
|
115% x 20%
equals 23% |
|
|
66,5% x 9%
equals 6% |
|
|
66,5% x 4,5%
equals 3% |
|
|
|
|
|
|
|
|
|
|
|
|
|
| Final bonus payable |
|
|
R1 400 000 |
|
|
R230 000 |
|
|
R24 000 |
|
|
R12 000 |
1 It is assumed that the Company performance was achieved 100%.
2 It is assumed that the team performance was achieved as follows:
2a 75% for executive director.
2b 100% for senior management and general staff level 2.
3 It is assumed that employee performance was as follows:
3a 150% for senior management.
3b 133% for general staff level 2.
4 On target bonus is respectively:
– 80% for executive director;
– 20% for senior management;
– 9% for general staff where a bonus is declared; and
– 4,5% for general staff where a bonus is not declared. |
Refer to the next section for parameters applicable to executive committee members.
Executive bonus parameters
The executive bonus parameters governing the bonus plan are summarised below:
Group
category |
|
|
Designation |
|
|
Company
performance |
|
|
Team
performance |
|
|
Minimum
bonus |
|
|
On
target |
|
|
Maximum
bonus |
|
|
|
|
|
|
|
|
|
|
|
|
|
|
|
|
|
|
|
| Group president
and CEO |
|
|
Group president and
CEO |
|
|
70% |
|
|
30% |
|
|
0% |
|
|
100% |
|
|
200% |
|
|
|
|
|
|
|
|
|
|
|
|
|
|
|
|
|
|
|
| Group executive
director |
|
|
Group CFO |
|
|
70% |
|
|
30% |
|
|
0% |
|
|
80% |
|
|
160% |
|
|
|
|
|
|
|
|
|
|
|
|
|
|
|
|
|
|
|
| Group chief
officers |
|
|
Group chief human
resources and
corporate affairs officer |
|
|
50% |
|
|
50% |
|
|
0% |
|
|
70% |
|
|
140% |
| |
|
|
Group chief technology
and information officer |
|
|
50% |
|
|
50% |
|
|
0% |
|
|
70% |
|
|
140% |
| |
|
|
Group chief
commercial officer
|
|
|
50% |
|
|
50% |
|
|
0% |
|
|
70% |
|
|
140% |
| |
|
|
Group chief operations
executive |
|
|
60% – Top 7
Large opcos |
|
|
40% |
|
|
0% |
|
|
70% |
|
|
140% |
| |
|
|
Group chief business
risk officer |
|
|
50% |
|
|
50% |
|
|
0% |
|
|
70% |
|
|
140% |
| |
|
|
Group chief strategy,
mergers and
acquisition officer |
|
|
50% |
|
|
50% |
|
|
0% |
|
|
70% |
|
|
140% |
| |
|
|
Group chief legal
counsel |
|
|
50% |
|
|
50% |
|
|
0% |
|
|
70% |
|
|
140% |
| |
|
|
Group chief enterprise
officer
|
|
|
50% |
|
|
50% |
|
|
0% |
|
|
70% |
|
|
140% |
| |
|
|
Group chief digital
officer |
|
|
50% |
|
|
50% |
|
|
0% |
|
|
70% |
|
|
140% |
|
|
|
|
|
|
|
|
|
|
|
|
|
|
|
|
|
|
|
Operating
company CEOs
(on the Group
exco) |
|
|
CEO: MTN South Africa |
|
|
60% – MTN
South Africa |
|
|
40% |
|
|
0% |
|
|
70% |
|
|
140% |
| |
|
CEO: MTN Nigeria |
|
|
60% – MTN
Nigeria |
|
|
40% |
|
|
0% |
|
|
70% |
|
|
140% |
Executive directors’ bonus calculations
For 2015, the executive directors’ bonuses were calculated in line with the approved bonus principles. Full
actual amounts of the bonuses paid can also be found on 88.
MTN operations’ bonus declarations
In line with the performance bonus rules, bonuses become payable within an operation once the committee
is satisfied that the minimum performance thresholds have been achieved. For the 2015 financial year, a
summary of the bonuses declared to the MTN Group operations is as follows:
| |
Bonus declared |
|
|
|
Bonus declared |
|
|
|
|
|
|
| MTN Group |
No |
|
|
Afghanistan |
Yes |
|
|
|
|
|
|
| South Africa |
Yes |
|
|
Congo-Brazzaville |
Yes |
|
|
|
|
|
|
| Nigeria |
No |
|
|
Rwanda |
Yes |
|
|
|
|
|
|
| Ghana |
Yes |
|
|
Zambia |
Yes |
|
|
|
|
|
|
| Cameroon |
No |
|
|
Liberia |
No |
|
|
|
|
|
|
| Ivory Coast |
No |
|
|
Conakry |
No |
|
|
|
|
|
|
| Uganda |
No |
|
|
Cyprus |
Yes |
|
|
|
|
|
|
| Syria |
Yes |
|
|
South Sudan |
Yes |
|
|
|
|
|
|
| Sudan |
Yes |
|
|
Iran |
Yes |
|
|
|
|
|
|
| Benin |
Yes |
|
|
Swaziland |
Yes |
|
|
|
|
|
|
| Yemen |
No |
|
|
Guinea-Bissau |
No |
Long-term incentive schemes (LTIs)
Long-term incentives to managerial and senior
employees are aimed at aligning their contributions
to shareholders’ expectations by sharing in the long-term
growth of the Company. Due to the fact that our
operations are spread across 22 African and Middle
Eastern countries, it is not always feasible to issue
Company stock to all employees as we are only
listed on the Johannesburg Stock Exchange. For this
reason, the Company operates a combination of
equity and cash-settled schemes.
The general rule is that participants are allocated
shares, options, or rights equivalent to a fraction of
their annual salary. Depending on the performance
of the Company measured using various indicators,
participants proportionately either receive cash,
equity or a combination of both. Although the
eligibility of participants is defined in the rules of the
schemes, MTN reserves the right to exclude
participation by certain employees by virtue of their
employment status, e.g. disciplinary, suspension,
and dismissal.
Since 2001, the Group has implemented the following schemes:
Share Option Scheme (SOS)
| Eligible participants |
|
|
Date
implemented |
|
|
Performance
conditions |
|
|
Last vesting
date |
|
|
Expiry period |
|
|
|
|
|
|
|
|
|
|
|
|
|
| All levels |
|
|
2001 |
|
|
Share price
based |
|
|
Unwound |
|
|
2015 |
|
|
|
|
|
|
|
|
|
|
|
|
|
|
|
|
|
|
|
|
|
|
|
|
|
|
The share option plan fully vested and reached its expiry period in January 2015. At the time of expiry,
10 years after the last award, all options were exercised with no employee forfeiting unexercised shares.
Share Appreciation Rights Scheme (SARS) and Share Rights Plan (SRP)
Objective: To promote the achievement of MTN Group’s strategic objectives measured using the
Company’s growth in share price. Participating employees share in the appreciation of the Company’s
share price between grant and vest.
| Eligible participants |
|
|
Date
implemented |
|
|
Performance
conditions |
|
|
Last vesting
date |
|
|
Expiry period |
|
|
|
|
|
|
|
|
|
|
|
|
|
| All employees at junior
management level and above |
|
|
2006 – SARS
2008 – SRP |
|
|
Share price
based |
|
|
2013
2015 |
|
|
2018
2020 |
|
|
|
|
|
|
|
|
|
|
|
|
|
|
|
|
|
|
|
|
|
|
|
|
|
|
Both the SARS and SRP were fully vested as at 2015 and are exercisable. Refer to 84. for the full
reconciliation of 2015 trading.
Performance Share Plan (PSP)
The PSP scheme is the current active and allocating plan, and is summarised as follows:
Objective: To promote the achievement of MTN Group’s strategic objectives measured using the Company’s
growth in share price and cash flow. Participating employees share in the Company’s achievement of the
set financial indicators over three years.
| Eligible participants |
|
|
Date
implemented |
|
|
Performance
conditions |
|
|
Last vesting
date |
|
|
Expiry period |
|
|
|
|
|
|
|
|
|
|
|
|
|
| All employees at junior
management level and
above |
|
|
2010 |
|
|
Total
shareholder
return (TSR)
Adjusted free
cash flow
(AFCF) |
|
|
2017 |
|
|
Not applicable |
|
|
|
|
|
|
|
|
|
|
|
|
|
|
|
|
|
|
|
|
|
|
|
|
|
|
Details about the PSP
- Share awards are at the discretion of the MTN Group board and the operating entities.
- Participation is limited to managerial employees and those in more senior positions only.
- Performance is measured using TSR and AFCF. An additional service element is applicable for non-executive
participating employees.
- Weightings are attached to each condition based on the seniority of the participant.
- The scheme has a three-year vesting period. Once the shares are vested and the board is satisfied with the
achievement of the performance conditions, participating employees receive either shares or the cash
equivalent.
Performance conditions
The accrual of each award is subject to the fulfilment of the conditions as illustrated below:
 |
|
Details
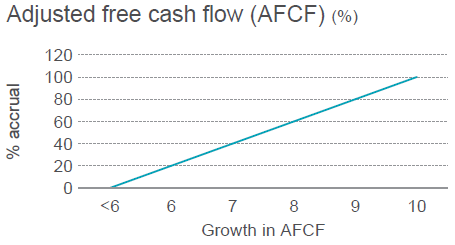
This condition is measured on a three-year
cumulative average growth rate (CAGR).
This is calculated as the growth from the average
AFCF in the three years preceding the grant date
to the average AFCF during the three-year
measurement period, using the following
parameters:
- 100% vesting at 10% growth
- 20% vesting at 6% growth
- 0% vesting below 6% growth
There is a sliding linear scale between each
point.
Weightings:
- 50% for executive employees
- 37,5% for general staff employees
|
| |
|
|
 |
|
Details
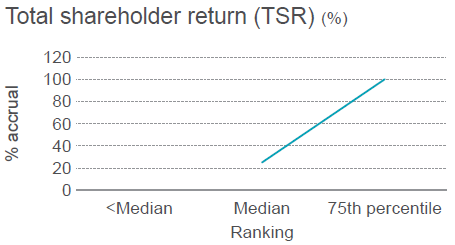
TSR measures the performance of the share
price relative to the JSE Top 20 Industrial index.
Accrual of shares is based on the achievement
of the set target:
- 100% vests if MTN is at the 75th percentile of
the comparator group
- 25% vests if MTN is at the median of the
comparator group
- 0% vests for ranking below the median of the
comparator group
TSR will be measured by comparing the 30-day
VWAP at the beginning and end of the three-year
period plus re-invested dividends and must be
positive.
Weightings:
- 50% for executive employees
- 37,5% for general staff employees
|
Historic performance of the scheme
A summary of the allocation is as follows:
| |
|
|
|
|
|
Condition achieved |
|
|
|
|
|
|
|
|
|
|
| Grant date |
|
|
Vesting date |
|
|
Adjusted free cash flow |
|
|
Total shareholder return |
|
|
|
|
|
|
|
|
|
|
29/06/11
29/12/11
28/12/12
20/12/13
19/12/14 |
|
|
31/12/13
29/06/14
28/12/15
19/12/16
18/12/17 |
|
|
0%
39,4%
0%
–
– |
|
|
32,5%
0%
0%
–
– |
|
|
|
|
|
|
|
|
|
|
|
|
|
|
|
|
|
|
|
|
Please refer to 
 for additional information on 95.
Employee Share Ownership (ESOP)
During 2010, MTN approved the allocation of shares to its lower-level employees under the Company’s Broad-Based Employee Share Scheme – Employee Share Ownership Plan (ESOP).
The scheme was intended to incentivise the designated employees and to identify them more closely with the
activities of the Company with the aim of promoting their continued growth by giving them shares. Participating
employees under the ESOP scheme had to retain ownership of their shares for a period of five years until
December 2015.
The scheme thus matured in December 2015. As the Company was in a cautionary period, only inactive
participants had the right to trade in these shares. Active employees were restricted until such a time when
the restriction was lifted.
A summary of the allocation is as follows:
Number of
participants as at
issue date |
|
|
Number of shares
allocated |
|
|
Plan vesting date |
|
|
Number of shares
traded
(as at
31 December 2015) |
|
|
Number of shares
outstanding
(as at
31 December 2015) |
|
|
|
|
|
|
|
|
|
|
|
|
|
| 3 461 |
|
|
1 384 400 |
|
|
1 December 2015 |
|
|
136 495 |
|
|
1 247 905 |
|
|
|
|
|
|
|
|
|
|
|
|
|
|
|
|
|
|
|
|
|
|
|
|
|
|
As at 31 December 2015, from a total of 3 461 participants:
- 1 358 allocated employees had left the employment of the Company for various reasons, voluntary and
involuntary; and
- 2 103 were still in the employ of the Company.
Thus the number of retained employees represents a retention rate of 61%.
- Investec was appointed as the Company’s preferred trading partner for employees who opted to trade their
shares.
- All share records will be held and administered internally by the Group company secretary department.
- Unexercised shares will remain in the Company’s records until such time that participants exercise them.
A summary of all previous allocations and the vesting dates made under the long-term incentive scheme is
presented below:
Equity share schemes vesting schedule
^ This offer includes an allocation with one year accelerated vesting.
^^ This offer was accelerated from 36 months to 30 months. |
| Key: |
✓ Allocation date  20% tranche vested (cumulative)  30% tranche vested (cumulative)
 Performance conditions evaluation  Non-vested portion of award ✗ Expiry |
Following the Company’s cautionary statement on
trading after Nigerian regulators imposed a fine on
MTN Nigeria, the annual PSP allocation (normally
planned for December of each year) was suspended
until further notice.
Further details on the performance measurement,
assessment periods, and settlement criteria are
available under the on 95.
MTN non-equity schemes for
employees in non-listed operations
outside South Africa
MTN offers non-South Africa-based employees
participation in the Group’s notional share option
(NSO) scheme. This scheme enhances MTN’s
commitment to the “One Group, One MTN”
philosophy.
Qualifying employees own options and also
participate in the growth of the Group and its
operations, as applicable. The main objective of the
NSO scheme is to encourage an alignment between
the individual interests of senior employees and the
long-term success of the Group. Thus, the scheme’s
design rewards employees for the value gain derived
from the NSO price per share appreciation between
the allocation and vesting dates.
The NSO scheme was reviewed in 2013 and a
proposal was presented to the R&HR committee to
change the mechanics of the scheme to align it with
the Group equity schemes. The committee supported
this recommendation and operations made NSO
allocations under the new rules effective 1 April
2014. The key aspects and changes of the NSO
scheme included:
- NSO awards are divided into Group-aligned
notional share scheme (GAN) NSO and locally
aligned notional share scheme (LAN) NSO.
- GAN NSO constitutes up to 30% of the total value
of the award and LAN NSO constitutes up to 70%
of the total value of the award.
- Gains under GAN NSO are measured by the MTN
Group’s share price movements between the
allocation date and exercise date, i.e. the difference
between the allocation and exercise prices
represents the gain.
- Gains under LAN NSO are based on the LAN
price movement between allocation and exercise.
The determination of the LAN price at allocation,
and subsequently at each annual valuation, is
as below:
– Allocation – LAN price valuation is reflective of
the increase in value of an operation through
alignment with the EBITDA financial indicator.
– Valuations – annual valuations of the LAN NSO
price are based on the appreciation or
depreciation with the LAN allocation price.
Non-executive director remuneration
The R&HR committee is responsible for advising on
the remuneration of non-executive directors (NEDs),
including reviewing remuneration recommendations
as put forward by executive management in
consultation with external remuneration consultants.
The committee also recommends remuneration for
approval by the board and shareholders. The
remuneration for NEDs is considered annually and is
determined in light of market practice and with
reference to the time, commitment and responsibilities
associated with the roles.
The MTN Group’s non-executive directors receive an
annual retainer and a meeting attendance fee. They
do not participate in any type of incentive scheme
nor do they receive any employee-related benefits.
During 2015, the board requested a review of the
non-executive director fees. An external benchmark
exercise was conducted where industry trends
and market rates were obtained from
PricewaterhouseCoopers Inc. and The Hay Group
(the Company’s preferred survey providers).
A gap analysis showed that certain directors
required an adjustment to their fees payable. A
motivation was submitted to the board and approved
for implementation in 2015.
For the 2016 financial period, the board did not approve an increase to the NED fees.
| |
|
|
Annual
retainer
fee
2015 |
|
|
Meeting
attendance
fee
2014 |
|
|
|
|
|
|
|
| MTN GROUP BOARD |
|
|
|
|
|
|
| Chairman |
|
|
R2 518 081 |
|
|
R139 893 |
| Member |
|
|
R212 492 |
|
|
R53 123 |
| International member |
|
|
€76 928 |
|
|
€7 693 |
|
|
|
|
|
|
|
| Special assignments or projects (per day) |
|
|
|
|
|
|
| Local non-executive director |
|
|
|
|
|
R22 639 |
| International non-executive director |
|
|
|
|
|
€3 373 |
|
|
|
|
|
|
|
| Ad hoc work performed by non-executive directors for special projects (hourly rate) |
|
|
|
|
|
R3 985 |
|
|
|
|
|
|
|
| Audit committee |
|
|
|
|
|
|
| Chairman |
|
|
R112 901 |
|
|
R34 828 |
| Member |
|
|
R61 681 |
|
|
R23 997 |
|
|
|
|
|
|
|
| Remuneration and human resources committee |
|
|
|
|
|
|
| Local chairman |
|
|
R84 303 |
|
|
R31 757 |
| International chairman |
|
|
€5 625 |
|
|
€3 590 |
| Local member |
|
|
R49 401 |
|
|
R23 289 |
| International member |
|
|
€3 297 |
|
|
€3 297 |
|
|
|
|
|
|
|
| Risk management, compliance committee and corporate governance committee |
|
|
|
|
|
|
| Chairman |
|
|
R84 303 |
|
|
R31 757 |
| Member |
|
|
R49 401 |
|
|
R23 289 |
| International member |
|
|
€3 297 |
|
|
€3 297 |
|
|
|
|
|
|
|
| Social and ethics committee |
|
|
|
|
|
|
| Chairman |
|
|
R84 303 |
|
|
R31 757 |
| Member |
|
|
R49 401 |
|
|
R23 289 |
|
|
|
|
|
|
|
| MTN Group Share Trust (trustees) |
|
|
|
|
|
|
| Chairman |
|
|
R74 929 |
|
|
R28 226 |
| Member |
|
|
R32 943 |
|
|
R15 530 |
|
|
|
|
|
|
|
| Tender committee |
|
|
|
|
|
|
| Chairman |
|
|
R74 929 |
|
|
R28 226 |
| Member |
|
|
R43 783 |
|
|
R20 641 |
Employment contracts
Group president and CEO (executive
director)
Following the resignation of the Group president
and CEO, RS Dabengwa, the board appointed
PF Nhleko to fulfil the role of executive chairman. To
enlist the services of PF Nhleko, the board entered
into a contract of employment with a service provider,
Captrust Investments Proprietary Limited. PF Nhleko
was appointed for a fixed term period of six months,
effective from 9 November 2015 and ending on
9 May 2016.
In consideration for PF Nhleko’s services, the
Company paid an agreed-upon service fee to the
service provider. His contract further stipulates that
the board, at its discretion at the end of the contract,
may award PF Nhleko with a bonus. Full details of
such payments to PF Nhleko in regard to this
executive directorship role are provided on 88.
In addition to this fixed term contract as an executive,
PF Nhleko continued to serve as chairman of the
MTN Group Limited board of directors, and as
such received all related director remuneration in
this regard. Full details of remuneration paid to
PF Nhleko in his capacity as director are provided
on 88.
Chief financial officer (executive
director)
The chief financial officer, BD Goschen, was
employed on a five-year fixed term contract which
expires in August 2018. Full details of remuneration
paid to BD Goschen in his capacity as director are
provided on 88.
Prescribed officers
Other prescribed officers of the Company are
employed on a full-time and permanent basis with
no indication of their termination of employment.
Restraint of trade and notice period
To safeguard the shareholders of the Company and
the proprietary, strategic, and confidential information
to which executive directors and prescribed officers
are privy to as a result of their employment, in 2014,
management recommended a contractual restriction
on the freedom of any executive director or
prescribed officer to conduct business with a
competitor. Under this agreement, new appointments
were required to sign a “restraint of trade agreement”
prohibiting them from taking employment with a
competitor company within six months from
termination of employment with MTN. For existing
executive directors and prescribed officers however,
given their current contracts excluded restraint
clauses, management continued to engage with
them in a bid to similarly agree to the restraint terms.
Where engagements are successful, the executive
director or prescribed officer is issued with an
annexure to their contract. This process is ongoing
and shall extend to 2016.
All appointments post-2014, both executive directors
and prescribed officers, have a six-month notice
period. Existing executive directors and prescribed
officers employed prior to 2014 all have a one-month
notice period, contractually agreed at their initial
appointments. In total, including the six-month
restraint period, this means that executive directors
and prescribed officers have a total of 12 months, a
period management believes is an adequate
measure to protect the Company’s information.
Directors’ emoluments
Directors’ and prescribed officers’ emoluments and
payments in the tables presented here have been
audited. Full details on directors’ and prescribed
officers’ emoluments and equity compensation
benefits for executive directors and directors of
major subsidiaries in respect of the share
appreciation rights and share rights schemes on
88. This also includes shareholdings and dealings
in MTN Group ordinary shares and MTN Zakhele
shares by MTN Group directors, prescribed officers,
Group secretary and directors and company
secretaries of major subsidiaries.
Emoluments, equity compensation and dealings in ordinary shares
Directors’ emoluments and related payments
| 2015 |
|
|
Date
appointed |
|
|
Salaries
R000 |
|
|
Post-employment
benefits
R000 |
|
|
Other
benefits†
R000 |
|
|
Compen-sation
for
loss of
office±
R000 |
|
|
Sub-total
R000 |
|
|
Share
gains#
R000 |
|
|
Total
R000 |
|
|
|
|
|
|
|
|
|
|
|
|
|
|
|
|
|
|
|
|
|
|
|
|
|
| Executive directors |
|
|
|
|
|
|
|
|
|
|
|
|
|
|
|
|
|
|
|
|
|
|
|
|
| RS Dabengwa^ |
|
|
1/10/2001 |
|
|
8 426 |
|
|
1 080 |
|
|
2 882 |
|
|
23 664 |
|
|
36 052 |
|
|
4 529 |
|
|
40 581 |
| BD Goschen |
|
|
22/07/2013 |
|
|
7 567 |
|
|
970 |
|
|
292 |
|
|
– |
|
|
8 829 |
|
|
427 |
|
|
9 256 |
| PF Nhleko^^ |
|
|
9/11/2015 |
|
|
5 000 |
|
|
– |
|
|
– |
|
|
– |
|
|
5 000 |
|
|
– |
|
|
5 000 |
|
|
|
|
|
|
|
|
|
|
|
|
|
|
|
|
|
|
|
|
|
|
|
|
|
| Total |
|
|
|
|
|
20 993 |
|
|
2 050 |
|
|
3 174 |
|
|
23 664 |
|
|
49 881 |
|
|
4 956 |
|
|
54 837 |
† Includes medical aid and unemployment insurance fund.
# Pre-tax gains on share-based payments.
^ Resigned 9 /11/2015.
^^ Fees paid to Captrust Investments Proprietary Limited.
± Compensation for loss of office comprises notice pay and a restraint of trade. |
| |
|
|
Date
appointed |
|
|
Retainer#
R000 |
|
|
Attendance#
R000 |
|
|
Special
board
R000 |
|
|
Strategy
session
R000 |
|
|
Ad hoc
work
R000 |
|
|
Total
R000 |
|
|
|
|
|
|
|
|
|
|
|
|
|
|
|
|
|
|
|
|
|
|
| Non-executive directors |
|
|
|
|
|
|
|
|
|
|
|
|
|
|
|
|
|
|
|
|
|
| PF Nhleko^^ |
|
|
28/05/2013 |
|
|
1 976 |
|
|
1 021 |
|
|
60 |
|
|
371 |
|
|
57 |
|
|
3 485 |
| KC Ramon@ |
|
|
1/06/2014 |
|
|
322 |
|
|
661 |
|
|
52 |
|
|
154 |
|
|
96 |
|
|
1 285 |
| KP Kalyan |
|
|
13/06/2006 |
|
|
343 |
|
|
602 |
|
|
40 |
|
|
154 |
|
|
8 |
|
|
1 147 |
| AT Mikatiנ |
|
|
18/07/2006 |
|
|
1 181 |
|
|
1 126 |
|
|
181 |
|
|
241 |
|
|
384 |
|
|
3 113 |
| MJN Njeke |
|
|
13/06/2006 |
|
|
331 |
|
|
442 |
|
|
56 |
|
|
106 |
|
|
20 |
|
|
955 |
| JHN Strydom |
|
|
11/03/2004 |
|
|
309 |
|
|
585 |
|
|
60 |
|
|
154 |
|
|
41 |
|
|
1 149 |
| AF van Biljon |
|
|
1/11/2002 |
|
|
212 |
|
|
480 |
|
|
60 |
|
|
154 |
|
|
73 |
|
|
979 |
| J van Rooyen |
|
|
18/07/2006 |
|
|
369 |
|
|
827 |
|
|
60 |
|
|
106 |
|
|
108 |
|
|
1 470 |
| MLD Marole |
|
|
1/01/2010 |
|
|
332 |
|
|
681 |
|
|
60 |
|
|
154 |
|
|
8 |
|
|
1 235 |
| NP Mageza |
|
|
1/01/2010 |
|
|
403 |
|
|
743 |
|
|
40 |
|
|
106 |
|
|
20 |
|
|
1 312 |
| A Harper◊ |
|
|
1/01/2010 |
|
|
1 215 |
|
|
1 358 |
|
|
181 |
|
|
241 |
|
|
104 |
|
|
3 099 |
| F Titi± |
|
|
1/07/2012 |
|
|
260 |
|
|
397 |
|
|
52 |
|
|
154 |
|
|
– |
|
|
863 |
| S Kheradpir ^^^^◊ |
|
|
8/07/2015 |
|
|
425 |
|
|
697 |
|
|
26 |
|
|
239 |
|
|
– |
|
|
1 365 |
|
|
|
|
|
|
|
|
|
|
|
|
|
|
|
|
|
|
|
|
|
|
| Total |
|
|
|
|
|
7 678 |
|
|
9 598 |
|
|
928 |
|
|
2 334 |
|
|
919 |
|
|
21 457 |
◊ Fees have been paid in euro.
† Fees are paid to M1 Limited.
^^^^ Appointed 8/07/2015.
± Resigned 31/12/2015.
# Retainer and attendance fees include fees for board and committee representation and meetings.
@ Fees paid to Anglogold Ashanti Limited.
^^ Fourth quarter fees paid to Captrust Investments Proprietary Limited. |
| 2014 |
|
|
Date
appointed |
|
|
Salaries
R000 |
|
|
Post-
employment
benefits
R000 |
|
|
Other
benefits◊
R000
|
|
|
Bonuses
R000 |
|
|
Sub-total
R000 |
|
|
Share
gains◊◊
R000 |
|
|
Total
R000 |
|
|
|
|
|
|
|
|
|
|
|
|
|
|
|
|
|
|
|
|
|
|
|
|
|
| Executive directors |
|
|
|
|
|
|
|
|
|
|
|
|
|
|
|
|
|
|
|
|
|
|
|
|
| RS Dabengwa |
|
|
1/10/2001 |
|
|
9 334 |
|
|
1 197 |
|
|
858 |
|
|
13 257 |
|
|
24 646 |
|
|
3 482 |
|
|
28 128 |
| BD Goschen |
|
|
22/07/2013 |
|
|
5 567 |
|
|
714 |
|
|
286 |
|
|
6 777 |
|
|
13 344 |
|
|
– |
|
|
13 344 |
|
|
|
|
|
|
|
|
|
|
|
|
|
|
|
|
|
|
|
|
|
|
|
|
|
| Total |
|
|
|
|
|
14 901 |
|
|
1 911 |
|
|
1 144 |
|
|
20 034 |
|
|
37 990 |
|
|
3 482 |
|
|
41 472 |
◊ Includes medical aid and unemployment insurance fund.
◊ ◊ Pre-tax gains on share-based payments. |
| |
|
|
Date
appointed |
|
|
Retainer#
R000 |
|
|
Attendance#
R000 |
|
|
Special
projects
R000 |
|
|
Strategy
session
R000 |
|
|
Ad hoc
work
R000 |
|
|
Total
R000 |
|
|
|
|
|
|
|
|
|
|
|
|
|
|
|
|
|
|
|
|
|
|
| Non-executive directors |
|
|
|
|
|
|
|
|
|
|
|
|
|
|
|
|
|
|
|
|
|
| PF Nhleko |
|
|
28/05/2013 |
|
|
1 084 |
|
|
608 |
|
|
92 |
|
|
183 |
|
|
– |
|
|
1 967 |
| KC Ramon^ |
|
|
1/06/2014 |
|
|
123 |
|
|
187 |
|
|
– |
|
|
96 |
|
|
21 |
|
|
427 |
| KP Kalyan |
|
|
13/06/2006 |
|
|
332 |
|
|
487 |
|
|
97 |
|
|
96 |
|
|
– |
|
|
1 012 |
| AT Mikatiנ |
|
|
18/07/2006 |
|
|
1 163 |
|
|
707 |
|
|
111 |
|
|
219 |
|
|
97 |
|
|
2 297 |
| MJN Njeke |
|
|
13/06/2006 |
|
|
311 |
|
|
388 |
|
|
20 |
|
|
96 |
|
|
– |
|
|
815 |
| JHN Strydom |
|
|
11/03/2004 |
|
|
299 |
|
|
459 |
|
|
20 |
|
|
96 |
|
|
42 |
|
|
916 |
| AF van Biljon |
|
|
1/11/2002 |
|
|
312 |
|
|
401 |
|
|
68 |
|
|
96 |
|
|
63 |
|
|
940 |
| J van Rooyen |
|
|
18/07/2006 |
|
|
364 |
|
|
533 |
|
|
90 |
|
|
96 |
|
|
21 |
|
|
1 104 |
| MLD Marole |
|
|
1/01/2010 |
|
|
310 |
|
|
775 |
|
|
21 |
|
|
96 |
|
|
– |
|
|
1 202 |
| NP Mageza |
|
|
1/01/2010 |
|
|
361 |
|
|
566 |
|
|
42 |
|
|
96 |
|
|
20 |
|
|
1 085 |
| A Harper◊ |
|
|
1/01/2010 |
|
|
1 177 |
|
|
852 |
|
|
– |
|
|
219 |
|
|
– |
|
|
2 248 |
| F Titi |
|
|
1/07/2012 |
|
|
253 |
|
|
352 |
|
|
– |
|
|
48 |
|
|
– |
|
|
653 |
|
|
|
|
|
|
|
|
|
|
|
|
|
|
|
|
|
|
|
|
|
|
| Total |
|
|
|
|
|
6 089 |
|
|
6 315 |
|
|
561 |
|
|
1 437 |
|
|
264 |
|
|
14 666 |
◊ Fees have been paid in euro.
† Fees are paid to M1 Limited.
# Retainer and attendance fees include fees for board and committee representation and meetings.
^ Fourth quarter fees paid to Anglogold Ashanti Limited. |
Prescribed officers’ emoluments and related payments
| 2015 |
|
|
Salaries
R000 |
|
|
Post-
employment
benefits
R000 |
|
|
Other
benefits
R000 |
|
|
Compen-sation
for loss
of office
R000 |
|
|
Bonuses
R000 |
|
|
Sub-total
R000 |
|
|
Share
gains
R000 |
|
|
Total
R000 |
|
|
|
|
|
|
|
|
|
|
|
|
|
|
|
|
|
|
|
|
|
|
|
|
|
| Prescribed officers |
|
|
|
|
|
|
|
|
|
|
|
|
|
|
|
|
|
|
|
|
|
|
|
|
| JA Desai |
|
|
9 490 |
|
|
949 |
|
|
2 586 |
|
|
– |
|
|
– |
|
|
13 025 |
|
|
295 |
|
|
13 320 |
| PD Norman |
|
|
4 473 |
|
|
573 |
|
|
60 |
|
|
– |
|
|
– |
|
|
5 106 |
|
|
1 465 |
|
|
6 571 |
| A Farroukh1 |
|
|
5 444 |
|
|
544 |
|
|
555 |
|
|
– |
|
|
– |
|
|
6 543 |
|
|
2 208 |
|
|
8 751 |
| S Fakie2 |
|
|
331 |
|
|
44 |
|
|
1 209 |
|
|
– |
|
|
– |
|
|
1 584 |
|
|
755 |
|
|
2 339 |
| KW Pienaar3 |
|
|
4 831 |
|
|
619 |
|
|
10 965 |
|
|
– |
|
|
– |
|
|
16 415 |
|
|
982 |
|
|
17 397 |
| P Verkade4 |
|
|
1 021 |
|
|
102 |
|
|
21 |
|
|
– |
|
|
– |
|
|
1 144 |
|
|
345 |
|
|
1 489 |
| Z Bulbulia5 |
|
|
3 691 |
|
|
473 |
|
|
785 |
|
|
13 254@ |
|
|
1 475 |
|
|
19 678 |
|
|
621 |
|
|
20 299 |
| M Ikpoki5 |
|
|
6 603 |
|
|
754 |
|
|
2 274 |
|
|
17 260# |
|
|
– |
|
|
26 891 |
|
|
|
|
|
26 891 |
| MD Fleischer |
|
|
5 044 |
|
|
647 |
|
|
123 |
|
|
– |
|
|
– |
|
|
5 814 |
|
|
– |
|
|
5 814 |
| M Nyati |
|
|
3 644 |
|
|
467 |
|
|
3 326 |
|
|
– |
|
|
634 |
|
|
8 071 |
|
|
– |
|
|
8 071 |
| H Singh6 |
|
|
508 |
|
|
65 |
|
|
129 |
|
|
– |
|
|
– |
|
|
702 |
|
|
– |
|
|
702 |
| S Sooklal7 |
|
|
4 006 |
|
|
514 |
|
|
88 |
|
|
– |
|
|
– |
|
|
4 608 |
|
|
– |
|
|
4 608 |
| A Fernandez8 |
|
|
5 503 |
|
|
550 |
|
|
88 |
|
|
– |
|
|
– |
|
|
6 141 |
|
|
– |
|
|
6 141 |
|
|
|
|
|
|
|
|
|
|
|
|
|
|
|
|
|
|
|
|
|
|
|
|
|
| Total |
|
|
54 589 |
|
|
6 301 |
|
|
22 209 |
|
|
30 514 |
|
|
2 109 |
|
|
115 722 |
|
|
6 671 |
|
|
122 393 |
1 Resigned on 31/07/2015.
2 Retired on 16/02/2015.
3 Retired on 31/12/2015.
4 Contract ended on 31/03/2015.
5 Mutual separation on 31/12/2015.
6 Appointed on 1/11/2015.
7 Appointed on 1/02/2015.
8 Appointed on 1/04/2015.
@ Compensation for loss of office comprises severance, restraint of trade and gratuity pay.
# Severance, leave and lifestyle benefits. |
| 2014 |
|
|
Salaries
R000 |
|
|
Post-
employment
benefits
R000 |
|
|
Other
benefits
R000 |
|
|
Bonuses
R000 |
|
|
Sub-total
R000 |
|
|
Share
gains
R000 |
|
|
Total
R000 |
|
|
|
|
|
|
|
|
|
|
|
|
|
|
|
|
|
|
|
|
|
|
| Prescribed officers |
|
|
|
|
|
|
|
|
|
|
|
|
|
|
|
|
|
|
|
|
|
| JA Desai |
|
|
7 865 |
|
|
786 |
|
|
2 230 |
|
|
9 217 |
|
|
20 098 |
|
|
1 460 |
|
|
21 558 |
| PD Norman |
|
|
4 233 |
|
|
543 |
|
|
256 |
|
|
3 634 |
|
|
8 666 |
|
|
1 179 |
|
|
9 845 |
| A Farroukh |
|
|
7 747 |
|
|
775 |
|
|
942 |
|
|
6 573 |
|
|
16 037 |
|
|
1 440 |
|
|
17 477 |
| SA Fakie |
|
|
3 161 |
|
|
412 |
|
|
402 |
|
|
2 991 |
|
|
6 966 |
|
|
911 |
|
|
7 877 |
| KW Pienaar |
|
|
4 570 |
|
|
586 |
|
|
363 |
|
|
5 309 |
|
|
10 828 |
|
|
1 018 |
|
|
11 846 |
| P Verkade |
|
|
4 144 |
|
|
414 |
|
|
1 067 |
|
|
3 515 |
|
|
9 140 |
|
|
– |
|
|
9 140 |
| Z Bulbulia |
|
|
3 527 |
|
|
452 |
|
|
286 |
|
|
858 |
|
|
5 123 |
|
|
598 |
|
|
5 721 |
| M Ikpoki |
|
|
6 505 |
|
|
586 |
|
|
1 896 |
|
|
4 440 |
|
|
13 427 |
|
|
– |
|
|
13 427 |
| M Fleisher^ |
|
|
4 433 |
|
|
568 |
|
|
40 |
|
|
4 271 |
|
|
9 312 |
|
|
– |
|
|
9 312 |
| M Nyati^ |
|
|
871 |
|
|
112 |
|
|
18 |
|
|
837 |
|
|
1 838 |
|
|
– |
|
|
1 838 |
|
|
|
|
|
|
|
|
|
|
|
|
|
|
|
|
|
|
|
|
|
|
| Total |
|
|
47 056 |
|
|
5 234 |
|
|
7 500 |
|
|
41 645 |
|
|
101 435 |
|
|
6 606 |
|
|
108 041 |
^ Appointed 1/02/2014.
^^ Appointed 1/10/2014. |
Equity compensation benefits for executive directors and directors of major subsidiaries in respect of the
share appreciation rights and share rights schemes
Offer
date |
|
|
Strike
price
R000 |
|
|
Vesting
R000 |
|
|
Number
outstanding
as at
31 December
2014 |
|
|
Exercised
2015 |
|
|
Exercise
date |
|
|
Exercise
price
R |
|
|
Number
outstanding
as at
31 December
2015 |
|
|
|
|
|
|
|
|
|
|
|
|
|
|
|
|
|
|
|
|
|
|
| RS Dabengwa† |
|
|
|
|
|
|
|
|
|
|
|
|
|
|
|
|
|
|
|
|
|
| 31/05/2006 |
|
|
56,83 |
|
|
30/11/2008 |
|
|
13 920 |
|
|
– |
|
|
– |
|
|
– |
|
|
13 920 |
| 31/05/2006 |
|
|
56,83 |
|
|
30/11/2009 |
|
|
26 440 |
|
|
– |
|
|
– |
|
|
– |
|
|
26 440 |
| 31/05/2006 |
|
|
56,83 |
|
|
30/11/2010 |
|
|
40 440 |
|
|
– |
|
|
– |
|
|
– |
|
|
40 440 |
| 21/11/2006 |
|
|
71,00 |
|
|
21/11/2008 |
|
|
8 680 |
|
|
– |
|
|
– |
|
|
– |
|
|
8 680 |
| 21/11/2006 |
|
|
71,00 |
|
|
21/11/2009 |
|
|
8 680 |
|
|
– |
|
|
– |
|
|
– |
|
|
8 680 |
| 21/11/2006 |
|
|
71,00 |
|
|
21/11/2010 |
|
|
13 020 |
|
|
– |
|
|
– |
|
|
– |
|
|
13 020 |
| 21/11/2006 |
|
|
71,00 |
|
|
21/11/2011 |
|
|
13 020 |
|
|
– |
|
|
– |
|
|
– |
|
|
13 020 |
| 19/03/2008 |
|
|
126,99 |
|
|
19/03/2010 |
|
|
14 440 |
|
|
– |
|
|
– |
|
|
– |
|
|
14 440 |
| 19/03/2008 |
|
|
126,99 |
|
|
19/03/2011 |
|
|
14 440 |
|
|
– |
|
|
– |
|
|
– |
|
|
14 440 |
| 19/03/2008 |
|
|
126,99 |
|
|
19/03/2012 |
|
|
21 660 |
|
|
– |
|
|
– |
|
|
– |
|
|
21 660 |
| 19/03/2008 |
|
|
126,99 |
|
|
19/03/2013 |
|
|
21 660 |
|
|
– |
|
|
– |
|
|
– |
|
|
21 660 |
|
|
|
|
|
|
|
|
|
|
|
|
|
|
|
|
|
|
|
|
|
|
| Total |
|
|
|
|
|
|
|
|
196 400 |
|
|
– |
|
|
– |
|
|
– |
|
|
196 400 |
|
|
|
|
|
|
|
|
|
|
|
|
|
|
|
|
|
|
|
|
|
|
| † Resigned 9 November 2015. |
|
|
|
|
|
|
|
|
|
|
|
|
|
|
|
|
|
|
|
|
|
| BD Goschen |
|
|
|
|
|
|
|
|
|
|
|
|
|
|
|
|
|
|
|
|
|
| 19/03/2008 |
|
|
126,99 |
|
|
19/03/2010 |
|
|
12 260 |
|
|
– |
|
|
– |
|
|
– |
|
|
12 260 |
| 19/03/2008 |
|
|
126,99 |
|
|
19/03/2011 |
|
|
12 260 |
|
|
– |
|
|
– |
|
|
– |
|
|
12 260 |
| 19/03/2008 |
|
|
126,99 |
|
|
19/03/2012 |
|
|
18 390 |
|
|
– |
|
|
– |
|
|
– |
|
|
18 390 |
| 19/03/2008 |
|
|
126,99 |
|
|
19/03/2013 |
|
|
18 390 |
|
|
– |
|
|
– |
|
|
– |
|
|
18 390 |
|
|
|
|
|
|
|
|
|
|
|
|
|
|
|
|
|
|
|
|
|
|
| Total |
|
|
|
|
|
|
|
|
61 300 |
|
|
– |
|
|
– |
|
|
– |
|
|
61 300 |
|
|
|
|
|
|
|
|
|
|
|
|
|
|
|
|
|
|
|
|
|
|
| F Moolman |
|
|
|
|
|
|
|
|
|
|
|
|
|
|
|
|
|
|
|
|
|
| 19/03/2008 |
|
|
126,99 |
|
|
19/03/2010 |
|
|
10 200 |
|
|
– |
|
|
– |
|
|
– |
|
|
10 200 |
| 19/03/2008 |
|
|
126,99 |
|
|
19/03/2011 |
|
|
10 200 |
|
|
– |
|
|
– |
|
|
– |
|
|
10 200 |
| 19/03/2008 |
|
|
126,99 |
|
|
19/03/2012 |
|
|
15 300 |
|
|
– |
|
|
– |
|
|
– |
|
|
15 300 |
| 19/03/2008 |
|
|
126,99 |
|
|
19/03/2013 |
|
|
15 300 |
|
|
– |
|
|
– |
|
|
– |
|
|
15 300 |
|
|
|
|
|
|
|
|
|
|
|
|
|
|
|
|
|
|
|
|
|
|
| Total |
|
|
|
|
|
|
|
|
51 000 |
|
|
– |
|
|
– |
|
|
– |
|
|
51 000 |
Equity compensation benefits for executive directors, prescribed officers, Company secretary of MTN Group
and directors of major subsidiaries in respect of the performance share plan
| Offer
date |
|
|
Vesting
date |
|
|
Number
outstanding
as at
31 December
2014 |
|
|
Exercised
|
|
|
Forfeited
|
|
|
Exercise
date |
|
|
Exercise
price
R |
|
|
Number
outstanding
as at
31 December
2015 |
|
|
|
|
|
|
|
|
|
|
|
|
|
|
|
|
|
|
|
|
|
|
| RS Dabengwa† |
|
|
|
|
|
|
|
|
|
|
|
|
|
|
|
|
|
|
|
|
|
| 29/12/2011 |
|
|
29/12/2014 |
|
|
111 600 |
|
|
(21 985) |
|
|
(89 615) |
|
|
17/03/15 |
|
|
218,62 |
|
|
– |
| 28/12/2012 |
|
|
28/12/2015 |
|
|
94 600 |
|
|
– |
|
|
(94 600) |
|
|
– |
|
|
– |
|
|
– |
| 20/12/2013 |
|
|
19/12/2016 |
|
|
87 800 |
|
|
– |
|
|
(87 800) |
|
|
– |
|
|
– |
|
|
– |
| 19/12/2014 |
|
|
18/12/2017 |
|
|
83 100 |
|
|
– |
|
|
(83 100) |
|
|
– |
|
|
– |
|
|
– |
|
|
|
|
|
|
|
|
|
|
|
|
|
|
|
|
|
|
|
|
|
|
| Total |
|
|
|
|
|
377 100 |
|
|
(21 985) |
|
|
(315 115) |
|
|
– |
|
|
– |
|
|
– |
|
|
|
|
|
|
|
|
|
|
|
|
|
|
|
|
|
|
|
|
|
|
| † Resigned 9 November 2015. |
|
|
|
|
|
|
|
|
|
|
|
|
|
|
|
|
|
|
|
|
|
| BD Goschen |
|
|
|
|
|
|
|
|
|
|
|
|
|
|
|
|
|
|
|
|
|
| 29/12/2011 |
|
|
29/12/2014 |
|
|
22 300 |
|
|
(4 393) |
|
|
(17 907) |
|
|
17/03/15 |
|
|
218,62 |
|
|
– |
| 28/12/2012 |
|
|
28/12/2015 |
|
|
26 500 |
|
|
– |
|
|
– |
|
|
– |
|
|
– |
|
|
26 500 |
| 20/12/2013 |
|
|
19/12/2016 |
|
|
43 700 |
|
|
– |
|
|
– |
|
|
– |
|
|
– |
|
|
43 700 |
| 19/12/2014 |
|
|
18/12/2017 |
|
|
54 700 |
|
|
– |
|
|
– |
|
|
– |
|
|
– |
|
|
54 700 |
|
|
|
|
|
|
|
|
|
|
|
|
|
|
|
|
|
|
|
|
|
|
| Total |
|
|
|
|
|
147 200 |
|
|
(4 393) |
|
|
(17 907) |
|
|
– |
|
|
– |
|
|
124 900 |
|
|
|
|
|
|
|
|
|
|
|
|
|
|
|
|
|
|
|
|
|
|
| PD Norman |
|
|
|
|
|
|
|
|
|
|
|
|
|
|
|
|
|
|
|
|
|
| 29/12/2011 |
|
|
29/12/2014 |
|
|
36 100 |
|
|
(7 112) |
|
|
(28 988) |
|
|
17/03/15 |
|
|
218,62 |
|
|
– |
| 28/12/2012 |
|
|
28/12/2015 |
|
|
30 600 |
|
|
– |
|
|
– |
|
|
– |
|
|
– |
|
|
30 600 |
| 20/12/2013 |
|
|
19/12/2016 |
|
|
28 400 |
|
|
– |
|
|
– |
|
|
– |
|
|
– |
|
|
28 400 |
| 19/12/2014 |
|
|
18/12/2017 |
|
|
27 000 |
|
|
– |
|
|
– |
|
|
– |
|
|
– |
|
|
27 000 |
|
|
|
|
|
|
|
|
|
|
|
|
|
|
|
|
|
|
|
|
|
|
| Total |
|
|
|
|
|
122 000 |
|
|
(7 112) |
|
|
(28 988) |
|
|
– |
|
|
– |
|
|
86 000 |
|
|
|
|
|
|
|
|
|
|
|
|
|
|
|
|
|
|
|
|
|
|
| Z Bulbulia^ |
|
|
|
|
|
|
|
|
|
|
|
|
|
|
|
|
|
|
|
|
|
| 29/12/2011 |
|
|
29/12/2014 |
|
|
15 300 |
|
|
(3 014) |
|
|
(12 286) |
|
|
17/03/15 |
|
|
218,62 |
|
|
– |
| 28/12/2012 |
|
|
28/12/2015 |
|
|
15 500 |
|
|
– |
|
|
– |
|
|
– |
|
|
– |
|
|
15 500 |
| 20/12/2013 |
|
|
19/12/2016 |
|
|
24 500 |
|
|
– |
|
|
(7 914) |
|
|
– |
|
|
– |
|
|
16 586 |
| 19/12/2014 |
|
|
18/12/2017 |
|
|
22 200 |
|
|
– |
|
|
(14 544) |
|
|
– |
|
|
– |
|
|
7 656 |
|
|
|
|
|
|
|
|
|
|
|
|
|
|
|
|
|
|
|
|
|
|
| Total |
|
|
|
|
|
77 500 |
|
|
(3 014) |
|
|
(34 744) |
|
|
– |
|
|
– |
|
|
39 742 |
|
|
|
|
|
|
|
|
|
|
|
|
|
|
|
|
|
|
|
|
|
|
| ^ Mutual separation on 31/12/2015. |
|
|
|
|
|
|
|
|
|
|
|
|
|
|
|
|
|
|
|
|
|
| KW Pienaar# |
|
|
|
|
|
|
|
|
|
|
|
|
|
|
|
|
|
|
|
|
|
| 29/12/2011 |
|
|
29/12/2014 |
|
|
24 200 |
|
|
(4 767) |
|
|
(19 433) |
|
|
17/03/15 |
|
|
218,62 |
|
|
– |
| 28/12/2012 |
|
|
28/12/2015 |
|
|
33 000 |
|
|
– |
|
|
– |
|
|
– |
|
|
– |
|
|
33 000 |
| 20/12/2013 |
|
|
19/12/2016 |
|
|
30 600 |
|
|
– |
|
|
(9 884) |
|
|
– |
|
|
– |
|
|
20 716 |
| 19/12/2014 |
|
|
18/12/2017 |
|
|
29 100 |
|
|
– |
|
|
(19 064) |
|
|
– |
|
|
– |
|
|
10 036 |
|
|
|
|
|
|
|
|
|
|
|
|
|
|
|
|
|
|
|
|
|
|
| Total |
|
|
|
|
|
116 900 |
|
|
(4 767) |
|
|
(48 381) |
|
|
– |
|
|
– |
|
|
63 752 |
|
|
|
|
|
|
|
|
|
|
|
|
|
|
|
|
|
|
|
|
|
|
| # Retired on 31/12/2015. |
|
|
|
|
|
|
|
|
|
|
|
|
|
|
|
|
|
|
|
|
|
| M Nyati |
|
|
|
|
|
|
|
|
|
|
|
|
|
|
|
|
|
|
|
|
|
| 19/12/2014 |
|
|
18/12/2017 |
|
|
21 900 |
|
|
– |
|
|
– |
|
|
– |
|
|
– |
|
|
21 900 |
|
|
|
|
|
|
|
|
|
|
|
|
|
|
|
|
|
|
|
|
|
|
| Total |
|
|
|
|
|
21 900 |
|
|
– |
|
|
– |
|
|
– |
|
|
– |
|
|
21 900 |
|
|
|
|
|
|
|
|
|
|
|
|
|
|
|
|
|
|
|
|
|
|
| JA Desai |
|
|
|
|
|
|
|
|
|
|
|
|
|
|
|
|
|
|
|
|
|
| 29/12/2011 |
|
|
29/12/2014 |
|
|
43 600 |
|
|
(8 589) |
|
|
(35 011) |
|
|
17/03/15 |
|
|
218,62 |
|
|
– |
| 28/12/2012 |
|
|
28/12/2015 |
|
|
41 400 |
|
|
– |
|
|
– |
|
|
– |
|
|
– |
|
|
41 400 |
| 20/12/2013 |
|
|
19/12/2016 |
|
|
44 400 |
|
|
– |
|
|
– |
|
|
– |
|
|
– |
|
|
44 400 |
| 19/12/2014 |
|
|
18/12/2017 |
|
|
44 500 |
|
|
– |
|
|
– |
|
|
– |
|
|
– |
|
|
44 500 |
|
|
|
|
|
|
|
|
|
|
|
|
|
|
|
|
|
|
|
|
|
|
| Total |
|
|
|
|
|
173 900 |
|
|
(8 589) |
|
|
(35 011) |
|
|
– |
|
|
– |
|
|
130 300 |
|
|
|
|
|
|
|
|
|
|
|
|
|
|
|
|
|
|
|
|
|
|
| M Ikpoki† |
|
|
|
|
|
|
|
|
|
|
|
|
|
|
|
|
|
|
|
|
|
| 20/12/2013 |
|
|
19/12/2016 |
|
|
36 900 |
|
|
– |
|
|
(14 619) |
|
|
– |
|
|
– |
|
|
22 281 |
| 19/12/2014 |
|
|
18/12/2017 |
|
|
37 400 |
|
|
– |
|
|
(24 502) |
|
|
– |
|
|
– |
|
|
12 898 |
|
|
|
|
|
|
|
|
|
|
|
|
|
|
|
|
|
|
|
|
|
|
| Total |
|
|
|
|
|
74 300 |
|
|
– |
|
|
(39 121) |
|
|
– |
|
|
– |
|
|
35 179 |
|
|
|
|
|
|
|
|
|
|
|
|
|
|
|
|
|
|
|
|
|
|
| † Mutual separation on 31/12/2015. |
|
|
|
|
|
|
|
|
|
|
|
|
|
|
|
|
|
|
|
|
|
| A Farroukh^ |
|
|
|
|
|
|
|
|
|
|
|
|
|
|
|
|
|
|
|
|
|
| 29/12/2011 |
|
|
29/12/2014 |
|
|
42 900 |
|
|
(8 451) |
|
|
(34 449) |
|
|
17/03/15 |
|
|
218,62 |
|
|
– |
| 28/12/2012 |
|
|
28/12/2015 |
|
|
40 800 |
|
|
– |
|
|
(40 800) |
|
|
– |
|
|
– |
|
|
– |
| 20/12/2013 |
|
|
19/12/2016 |
|
|
43 800 |
|
|
– |
|
|
(43 800) |
|
|
– |
|
|
– |
|
|
– |
| 19/12/2014 |
|
|
18/12/2017 |
|
|
43 900 |
|
|
– |
|
|
(43 900) |
|
|
– |
|
|
– |
|
|
– |
|
|
|
|
|
|
|
|
|
|
|
|
|
|
|
|
|
|
|
|
|
|
| Total |
|
|
|
|
|
171 400 |
|
|
(8 451) |
|
|
(162 949) |
|
|
– |
|
|
– |
|
|
– |
|
|
|
|
|
|
|
|
|
|
|
|
|
|
|
|
|
|
|
|
|
|
| ^ Resigned on 31/07/2015. |
|
|
|
|
|
|
|
|
|
|
|
|
|
|
|
|
|
|
|
|
|
| M Fleischer |
|
|
|
|
|
|
|
|
|
|
|
|
|
|
|
|
|
|
|
|
|
| 29/12/2011 |
|
|
18/12/2017 |
|
|
30 400 |
|
|
– |
|
|
– |
|
|
– |
|
|
– |
|
|
30 400 |
|
|
|
|
|
|
|
|
|
|
|
|
|
|
|
|
|
|
|
|
|
|
| Total |
|
|
|
|
|
30 400 |
|
|
– |
|
|
– |
|
|
– |
|
|
– |
|
|
30 400 |
|
|
|
|
|
|
|
|
|
|
|
|
|
|
|
|
|
|
|
|
|
|
| F Moolman |
|
|
|
|
|
|
|
|
|
|
|
|
|
|
|
|
|
|
|
|
|
| 29/12/2011 |
|
|
29/12/2014 |
|
|
15 200 |
|
|
(2 994) |
|
|
(12 206) |
|
|
17/03/15 |
|
|
218,62 |
|
|
– |
| 28/12/2012 |
|
|
28/12/2015 |
|
|
14 600 |
|
|
– |
|
|
– |
|
|
– |
|
|
– |
|
|
14 600 |
| 20/12/2013 |
|
|
19/12/2016 |
|
|
15 700 |
|
|
– |
|
|
– |
|
|
– |
|
|
– |
|
|
15 700 |
| 19/12/2014 |
|
|
18/12/2017 |
|
|
15 700 |
|
|
– |
|
|
– |
|
|
– |
|
|
– |
|
|
15 700 |
|
|
|
|
|
|
|
|
|
|
|
|
|
|
|
|
|
|
|
|
|
|
| Total |
|
|
|
|
|
61 200 |
|
|
(2 994) |
|
|
(12 206) |
|
|
– |
|
|
– |
|
|
46 000 |
|
|
|
|
|
|
|
|
|
|
|
|
|
|
|
|
|
|
|
|
|
|
| SB Mtshali |
|
|
|
|
|
|
|
|
|
|
|
|
|
|
|
|
|
|
|
|
|
| 29/12/2011 |
|
|
29/12/2014 |
|
|
9 005 |
|
|
(3 582) |
|
|
(5 423) |
|
|
17/03/15 |
|
|
218,62 |
|
|
– |
| 28/12/2012 |
|
|
28/12/2015 |
|
|
6 400 |
|
|
– |
|
|
– |
|
|
– |
|
|
– |
|
|
6 400 |
| 20/12/2013 |
|
|
19/12/2016 |
|
|
6 000 |
|
|
– |
|
|
– |
|
|
– |
|
|
– |
|
|
6 000 |
| 19/12/2014 |
|
|
18/12/2017 |
|
|
5 800 |
|
|
– |
|
|
– |
|
|
– |
|
|
– |
|
|
5 800 |
|
|
|
|
|
|
|
|
|
|
|
|
|
|
|
|
|
|
|
|
|
|
| Total |
|
|
|
|
|
27 205 |
|
|
(3 582) |
|
|
(5 423) |
|
|
– |
|
|
– |
|
|
18 200 |
|
|
|
|
|
|
|
|
|
|
|
|
|
|
|
|
|
|
|
|
|
|
| S Fakie^^ |
|
|
|
|
|
|
|
|
|
|
|
|
|
|
|
|
|
|
|
|
|
| 29/12/2011 |
|
|
29/12/2014 |
|
|
18 609 |
|
|
(3 666) |
|
|
(14 943) |
|
|
17/03/15 |
|
|
218,62 |
|
|
– |
|
|
|
|
|
|
|
|
|
|
|
|
|
|
|
|
|
|
|
|
|
|
| Total |
|
|
|
|
|
18 609 |
|
|
(3 666) |
|
|
(14 943) |
|
|
– |
|
|
– |
|
|
– |
|
|
|
|
|
|
|
|
|
|
|
|
|
|
|
|
|
|
|
|
|
|
| ^^ Retired on 16/02/2015 |
|
|
|
|
|
|
|
|
|
|
|
|
|
|
|
|
|
|
|
|
|
| S Ntsele± |
|
|
|
|
|
|
|
|
|
|
|
|
|
|
|
|
|
|
|
|
|
| 29/12/2011 |
|
|
29/12/2014 |
|
|
6 800 |
|
|
(2 705) |
|
|
(4 095) |
|
|
17/03/15 |
|
|
218,62 |
|
|
– |
| 28/12/2012 |
|
|
28/12/2015 |
|
|
4 500 |
|
|
– |
|
|
– |
|
|
– |
|
|
– |
|
|
4 500 |
| 20/12/2013 |
|
|
19/12/2016 |
|
|
5 300 |
|
|
– |
|
|
– |
|
|
– |
|
|
– |
|
|
5 300 |
| 19/12/2014 |
|
|
18/12/2017 |
|
|
5 000 |
|
|
– |
|
|
– |
|
|
– |
|
|
– |
|
|
5 000 |
|
|
|
|
|
|
|
|
|
|
|
|
|
|
|
|
|
|
|
|
|
|
| Total |
|
|
|
|
|
21 600 |
|
|
(2 705) |
|
|
(4 095) |
|
|
– |
|
|
– |
|
|
14 800 |
Directors, prescribed officers, company secretary of the MTN Group and directors and company secretaries
of major subsidiaries’ shareholding and dealings in ordinary shares
Directors, prescribed officers, company secretary of the MTN Group and directors and company secretaries
of major subsidiaries’ shareholding and dealings in ordinary shares
| |
|
|
December
2015 |
|
|
December
2014 |
|
|
Beneficial |
|
|
|
|
|
|
|
|
|
|
| RS Dabengwa^ |
|
|
1 473 552 |
|
|
1 473 552 |
|
|
Direct |
| NP Mageza |
|
|
400 |
|
|
400 |
|
|
Indirect |
| PD Norman#† |
|
|
300 970 |
|
|
300 970 |
|
|
Direct |
| MJN Njeke |
|
|
10 |
|
|
10 |
|
|
Direct |
| BD Goschen#† |
|
|
44 393 |
|
|
40 000 |
|
|
Direct |
| KW Pienaar#@ |
|
|
455 261 |
|
|
455 261 |
|
|
Direct |
| S Ntsele# |
|
|
4 000 |
|
|
– |
|
|
Direct |
| KC Ramon |
|
|
3 244 |
|
|
– |
|
|
Direct |
| KC Ramon |
|
|
9 901 |
|
|
– |
|
|
Indirect |
| KP Kalyan |
|
|
1 373 |
|
|
– |
|
|
Direct |
|
|
|
|
|
|
|
|
|
|
|
|
|
|
|
|
|
|
|
|
| Total |
|
|
2 293 104 |
|
|
2 270 193 |
|
|
|
^ Resigned 9/11/2015.
† Prescribed officer.
# Major subsidiary director.
@ Retired 31/12/2015. |
Subsequent to the year end there were no changes in the directors’ beneficial interest in MTN Group.
Directors, prescribed officers, company secretary of the MTN Group and directors and Company secretaries
of major subsidiaries relating to MTN Zakhele:
The following persons, being directors of MTN Group Limited and its major subsidiaries and the company
secretary were allocated the following number of MTN Zakhele shares which has a shareholding in MTN Group
Limited shares
| Beneficiary\ |
|
|
Nature of interest |
|
|
Shares |
|
|
|
|
|
|
|
| PF Nhleko |
|
|
Direct beneficial |
|
|
2 010 700 |
| KP Kalyan |
|
|
Direct beneficial |
|
|
27 700 |
| MLD Marole |
|
|
Direct beneficial |
|
|
15 700 |
| MJN Njeke |
|
|
Direct beneficial |
|
|
6 700 |
| NP Mageza |
|
|
Indirect beneficial |
|
|
51 420 |
| SB Mtshali |
|
|
Indirect beneficial |
|
|
6 500 |
| CWN Molope |
|
|
Direct beneficial |
|
|
1 000 |
| F Titi |
|
|
Indirect beneficial |
|
|
15 500 |
| SA Fakie^ |
|
|
Direct beneficial |
|
|
1 000 |
|
|
|
|
|
|
|
|
|
|
|
|
|
|
| Total |
|
|
|
|
|
2 136 220 |
Resigned 31/12/2015.
^ Retired 16/02/2015. |
Subsequent to the year end there were no changes in the directors’ beneficial interest in MTN Zakhele.