|
 |
Integrated report for the year ended 31 December 2015 |
|
|
| You are here: Financial review / Next: MTN South Africa's performance and outlook |
Financial reviewFinancial snapshot
Operating in a challenging environmentMTN Group’s 2015 financial results reflect the
challenging operating environment the business
experienced in the year, details of which are
discussed fully in the material issues section of this
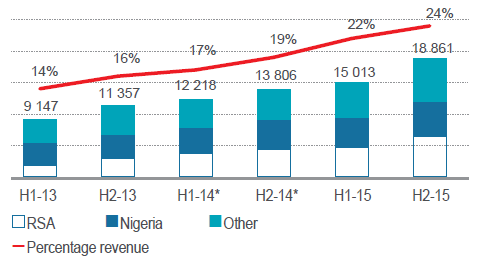
report ( Reported basic headline earnings per share (HEPS) declined by 51,4%** to 746 cents**. This was largely a result of the provision for the Nigeria regulatory fine (R9 287 million), which had a 402 cents negative impact on HEPS. Excluding this, HEPS declined 25,3%. In addition, HEPS was negatively impacted by hyperinflation of 54 cents (positive impact of 69 cents in 2014) and losses from our investment in African Internet Holdings (AIH) and Middle East Internet Holdings (MEIH) of 34 cents (versus 7 cents in 2014) and from the tower companies of 39 cents (versus 16 cents in 2014). While these investments are a short-term drag on reported earnings, they remain key elements in the long-term strategy of the Group. Excluding the impact of the Nigeria regulatory fine provision, hyperinflation and the impact of AIH, MEIH and the towers, on a like-for-like basis, HEPS declined 14,3%. Notwithstanding the challenging operating environment, MTN continued to benefit from its significant scale and footprint. The Group’s subscriber base increased by 4,1% to 232,5 million, despite the disconnection of 10,4 million subscribers to ensure compliance with subscriber regulatory registration requirements in Nigeria and Uganda. MTN Nigeria and MTN Uganda disconnected 6,7 million and 3,7 million subscribers respectively. Subscriber growth was achieved through attractive segmented below-the-line campaigns and an increased focus on the customer experience enabling the Group to maintain its leadership position in 15 markets. RevenueData revenue (ZAR million)
Group revenue remained flat in the year largely due to a decline in voice revenue in Nigeria and a reduction in handset revenue in South Africa following the industrial action experienced in the first half of the year which led to the lower distribution of handsets. This was, however, largely offset by an increase in data revenue across the business. Lower voice tariffs, which declined by 25% across operations in the year (average price per minute in US dollar terms), led to a 15% increase in billable minutes. Voice revenue continued to come under pressure as a result of heightened competition and the related use of multiple SIM cards as well as pressure on consumer spending. The Group benefited from a 108,5% increase in data traffic and an increased take-up of digital services. Despite a 45% decline in the effective data tariff (in US dollar terms), Group data revenue increased by 30,2% (32,6%*), partly offsetting a 5,6% (4,5%*) decline in voice revenue. Data revenue, including digital services, contributed 23,1% to total revenue. MTN Nigeria’s competitiveness in the market was compromised by the suspension of regulatory services in October 2015. Under this suspension, the Nigerian Communication Commission (NCC) withdrew its approval process for new tariff plans and promotions until certain tariff plans and promotions linked to the “dominant operator” ruling were removed from the market. This, combined with the disconnection of subscribers in the year, negatively impacted MTN Nigeria’s results. MTN Nigeria continued to engage with the regulator regarding the “dominant operator” ruling. MTN South Africa continued to show encouraging service revenue, which excludes handset revenue and other revenue, growth trends, regaining relevance in the prepaid segment in the second half of the year. Revenue growth in South Africa was supported by strong growth in data, benefiting from extensive 3G and LTE network rollout in the year. EBITDA margin
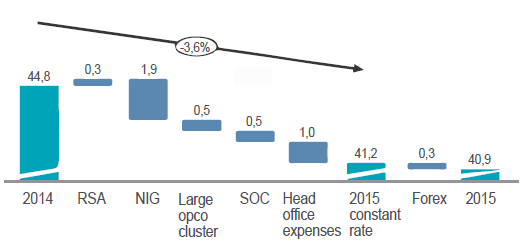
The margin on Group earnings before interest, tax, depreciation, amortisation and goodwill impairment losses (EBITDA) declined by 3,9 percentage points (pp) to 40,9%. This was negatively impacted by an impairment for obsolete handsets in South Africa (R592 million) and an interconnect debt provision in Nigeria (R503 million). In addition, 2014 EBITDA had been higher as a result of the Belgacom International Carrier Services (BICS) five-year profit amortisation, which ended in 2014 (R364 million) and a provision raised for Syria related to the build-operate-transfer licence, which was reversed in 2014 (R497 million). The underlying EBITDA margin was impacted by lower revenue growth, higher inflation, costs associated with the extensive network rollout and the depreciation of local currencies against the US dollar, which made foreign-denominated payments more costly. Higher lease costs associated with the sale of towers in Nigeria and commissions associated with new revenue streams also impacted the margin. The Group, however, continued to make good progress during the year on cost-containment initiatives, including lower advertising and staff costs as well as procurement efficiencies. Cash flowCash inflows generated by operations decreased by 10,9%** to R57 598 million** mainly as a result of lower EBITDA and a R5 221 million** increase in working capital. Capital expenditureCapital expenditure (capex) increased by 15,7% to R29 199 million with a key focus on 3G and LTE rollout. MTN South Africa’s capex amounted to R10 948 million, representing 37,5% of total capex. During the year, the Group rolled out 3 116 2G sites, 7 891 co-located 3G sites and 5 241 co-located LTE sites. The Group also rolled out 1 469km of long distance fibre and connected a total of 1 164 sites to fibre, enabling better quality data networks across operations. The Group plans to spend R30 814 million on its capex programme in 2016. Financial positionNet debt increased to R31 635 million** from R4 543 million** in 2014. This was largely due to an increase in capital expenditure in South Africa and the acquisition of 4G/LTE licence, digital TV spectrum and the purchase of Visafone in Nigeria. * Constant currency (organic) information. |
 0% to R147 063m
 19% to R59 125m


 11