
We operate in 16 markets on two continents and connect 290.9 million customers. This represents the reach of where we create value, organised into our operations in South Africa, Nigeria and our Markets (SEA, WECA and MENA). These are managed through robust operational and governance oversight structures, which underpin our pan-African growth strategy.
| MTN Group effective shareholding | Subscribers | |||
 MTN South Africa MTN South Africa |
100.0% | 39.8m | ||
 MTN Nigeria MTN Nigeria |
76.3% | 80.9m | ||
| SEA | ||||
 MTN Uganda▲ MTN Uganda▲ |
76.0% | 22.0m | ||
 MTN Rwanda MTN Rwanda |
80.0% | 7.6m | ||
 MTN Zambia MTN Zambia |
89.8% | 6.4m | ||
 MTN South Sudan MTN South Sudan |
100.0% | 3.3m | ||
 Mascom BotswanaΔ Mascom BotswanaΔ |
53.1% | 1.7m | ||
 MTN EswatiniΔ MTN EswatiniΔ |
30.0% | 1.0m | ||
| WECA+ | ||||
 MTN Ghana▲# MTN Ghana▲# |
73.9% | 28.5m | ||
 MTN Cameroon MTN Cameroon |
80.0% | 11.9m | ||
 MTN Côte d'Ivoire MTN Côte d'Ivoire |
66.8% | 16.3m | ||
 MTN Benin MTN Benin |
75.0% | 7.2m | ||
 MTN Congo-Brazzaville MTN Congo-Brazzaville |
100.0% | 3.8m | ||
 LonestarCell (MTN Liberia) LonestarCell (MTN Liberia) |
60.0% | 2.2m | ||
| MENA+ | ||||
 MTN Sudan MTN Sudan |
85.0% | 2.5m | ||
| MTN IrancellΔ | 49.0% | 55.6m | ||
| Associates, JVs and other investmentsΔ | ||||
| aYo | 50.0% | |||
| IHS roup | 25.7% | |||
| Snapp GroupΔ | 29.5% | |||
| Middle East Tech Ventures Holding | 50.0% | |||
Our financial performance
service revenue
data revenue
fintech revenue
EBITDA
capex intensity
capex (ex-leases)
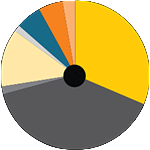
By geography (%)
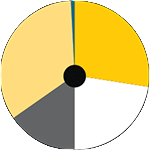
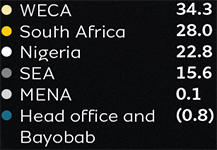
By geography (%)
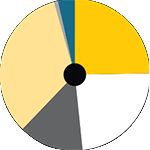
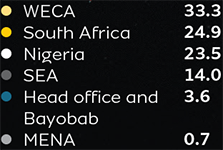
By services (%)

| ▲ | Localisations. |
| Δ | Equity accounted, not under MTN operation. |
| # | Legal ownership is 72.0%. |
| + | In 2024, we exited Afghanistan, Guinea-Bissau and Guinea-Conakry, in line with our portfolio optimisation priority. |