
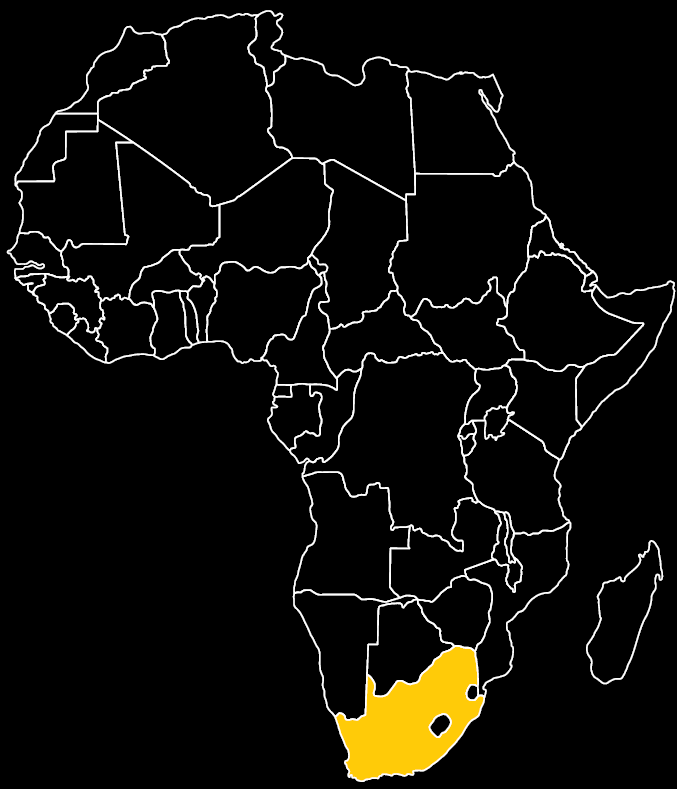
Service revenue increased by
3.1%

Outgoing voice revenue declined by
5.5%
Data revenue increased by
2.9%

Fintech revenue increased by

46.8%
Enterprise revenue increased by
10.8%

Wholesale revenue declined by
0.4%
(including incoming voice revenue)
EBITDA increased by
5.1%
(up
5.5%, excluding
gain of disposal of
towers)

EBITDA margin increased by 1.3pp to

37.4%
(down 1.5pp to 37.4% excluding gain on disposal of towers)
Capex of
R16.3bn
on IFRS 16 basis
(R9.8bn ex-leases)
MTN SA continued to navigate a challenging macro environment in 2024, with interest rates remaining relatively elevated and economic growth subdued. However, the slowing inflation rate and the introduction of the two-pot retirement system benefited consumers, increasing their ability to spend. Within the telecoms sector, competition in the market intensified.
In Q1 2024, MTN SA completed its resilience initiatives, which were incorporated into capex spend. This supported the continued improvement in customer satisfaction, a key revenue enabler, as reflected in MTN SA's NPS, which achieved the leading position in Q4.
MTN SA sustained a resilient overall performance with service revenue growth of 3.1% for the year. This growth was bolstered by network availability improvement and commercial initiatives. While total service revenue moderated slightly to 2.5% in Q4, largely due to base effects and lower prepaid performance, the business delivered some encouraging acceleration in key commercial metrics in the latter part of the year. Prepaid data returned to growth from November as we began to lap the anniversary of the impact of bundle recovery. The overall MTN SA result was supported by a 6.4% increase in the number of subscribers to 39.8 million, a net addition of 2.4 million during the year. Postpaid subscribers (excluding telemetry) increased by 6.1% to 4.3 million, driven by stronger uptake of home propositions, as well as integrated voice and data plans.
Prepaid customers increased by 5.5% to 29.9 million. Customer value management (CVM) initiatives continued to gain momentum in 2024, with personalised bundle offerings now available across multiple channels. These offerings, designed to enhance pricing power and provide greater flexibility for consumers. As a result, CVM adoption saw steady growth, rising to 34% in Q4, up from 29% in Q4 2023, reflecting strong customer adoption.
Total data revenue increased by 2.9%, with an encouraging acceleration in growth to 5.5% in Q4, and contributed 47.8% to MTN SA's total service revenue. This growth was driven by a 6.8% increase in active data subscribers to 21.8 million, with a YoY rise in data traffic by 28.3%. Data consumption per active prepaid data subscriber amounted to nearly 3.2GB per month (up 9.5% YoY), while an active postpaid data subscriber's consumption increased to 22.5GB per month (up 36.6% YoY), with the bulk of the growth attributed to FWA, as more customers adopt home propositions.
The consumer postpaid business saw a 4.5% increase in service revenue, driven by a rise in subscriber numbers, continued strong data usage and price adjustments effected in February 2024. The result reflects an uptick in postpaid service revenue in the latter part of the year, with H2 growth of 5.7% and a strong Q4 (up 7.2%). Furthermore, MTN SA continued to execute on its home strategy, revitalising postpaid FWA, FTTH and mobile internet offerings, which were well received by customers. This resulted in a 3.5% YoY base expansion.
The consumer prepaid business recorded service revenue growth of 0.8%, with Q4 experiencing a slight slowdown in momentum (up 0.3% YoY). This was largely due to increased competitive intensity in the market as we increased prices in May 2024 and value-seeking customers continued to optimise their spend. Prepaid data returned to mid-single-digit growth from November, as we began to lap the anniversary of the impact of XtraTime bundle recovery.
Outgoing voice revenue declined by 5.5% (down 4.6%, including incoming voice), which reflected a major progress in trend compared to the 12.1% decline in 2023. The outcome in voice performance was also enabled by an acceleration in XtraTime penetration, which reached 40.3% in Q4, up from 36.4% in Q4 2023.
The enterprise business continued to deliver strong double-digit performance, with service revenue growth of 10.8% for 2024.
Wholesale revenue (including incoming voice) declined marginally by 0.4%, with Q4 2024 affected by higher revenue recognised for Cell C in Q4 2023. Excluding incoming voice, wholesale revenue declined by 0.9%.
The fintech ecosystem continued to grow strongly, with total service revenue up by 46.8%, underpinned by strong XtraTime growth following initiatives to increase the market penetration. MoMo revenue is scaling rapidly from a low base, growing at 171.6%. This was driven by the ongoing expansion of the product portfolio, including insurance and payment services.

The digital business showed growth of 10.6% for the year, driven by an 18.0% increase in rich-media services and 40.2% in mobile advertising. MTN SA signed exclusivity deals with Showmax EPL and Disney+, driving real benefits to customers, which helped customer acquisition and retention.
MTN SA's EBITDA rose by 5.1% YoY, up 4.4% excluding the gain from the disposal of towers and R212 million of proceeds (2023: nil) from the sale of the insurance receivable. EBITDA, which included a gain resulting from lease amendments, grew ahead of service revenue as MTN SA's concerted expense efficiency initiatives yielded significant benefits.
The EBITDA margin of 37.4% was 1.3pp higher YoY, up 1.1pp to 37.0% excluding the gain on disposal of towers and proceeds from the sale of the insurance receivable.
Profit after tax (PAT) was up 4.9%, supported by commercial execution and operational efficiencies, also benefiting from the sale of the device book.
In line with the drive to protect the environment, MTN SA reduced its Scope 1 and 2 emissions in the year – exceeding the targeted reduction. This was achieved through various interventions, including the energisation of a 4.9MW solar park with 6MWh of battery storage. Expanding broadband coverage, especially in rural communities, is another important priority. By leveraging its spectrum assets, MTN SA expanded its broadband coverage to 98.7%, further promoting inclusion and connectivity in South Africa.
The MTN SA Foundation continued to play a key role in addressing socioeconomic challenges through initiatives that focus on education, digital skills, entrepreneurship, arts and culture and the promotion of women and youth in the digital economy. To support these objectives, MTN SA launched the MTN Skills Academy with a view to equipping the youth with the relevant digital skills such as cybersecurity, AI and machine learning, thereby increasing their prospects of employment.
The MTN Online School continued to support over 1.2 million registered users. MTN SA has, together with the Department of Basic Education, launched the Connecting Every Child campaign, which aims to rally corporate South Africa to support the drive to provide 30 000 digital devices to learners in rural and disadvantaged communities.



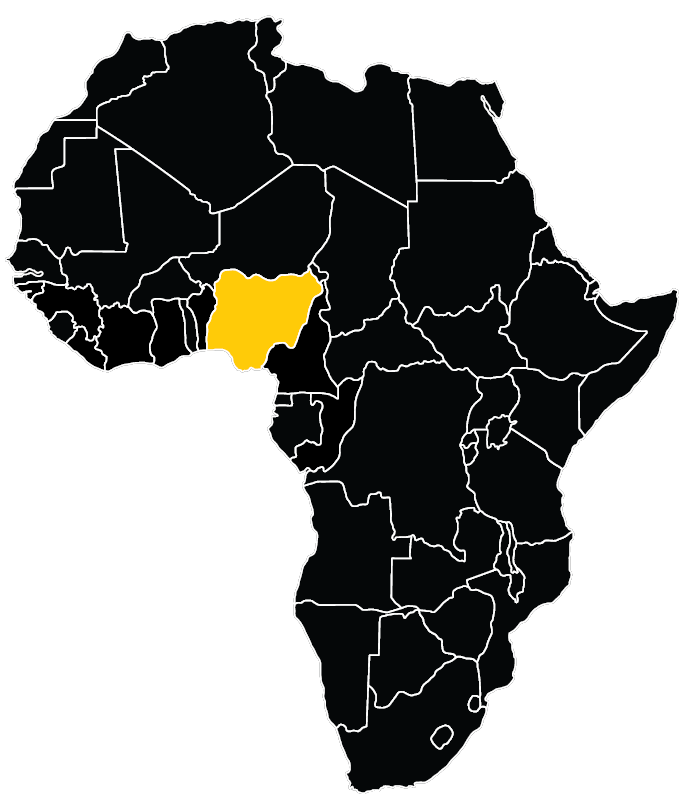
Service revenue increased by
35.6%*
Voice revenue increased by
14.2%*
Data revenue increased by
49.6%*
Fintech revenue increased by
21.6%*
Digital revenue increased by
95.4%*
EBITDA increased by
7.5%*
EBITDA margin decreased by 10.3pp to
38.9%*
Capex of
R18.0bn
on IFRS 16 basis
(R5.2bn ex-leases)
MTN Nigeria reported a resilient set of annual results, reflecting the strong commitment to drive growth and manage costs. Despite facing significant macroeconomic headwinds, including record high inflation, as well as ongoing currency and energy price volatility, MTN Nigeria remained focused on executing its strategy and creating long-term value for stakeholders. This included significant progress across all the major initiatives outlined in April 2024 to support the recovery of MTN Nigeria's profitability and capital position. Following the year-end, authorities in Nigeria approved tariff adjustments for the telecoms industry, which will be crucial for its sustainability.
Supported by strong commercial momentum, service revenue was up by 35.6%*, led by data, voice, fintech and digital services, as well as the once-off revenue recognition relating to outstanding USSD debt owed by deposit money banks. Excluding the USSD revenue recognition, underlying service revenue growth remained robust and was up 32.6%*, which was at the upper end of 2024 guidance.
The result was supported by MTN Nigeria's robust strategy for acquiring and retaining subscribers, which mitigated the impacts of the NIN-SIM registration regulations while boosting usage. Voice revenue was solid, increasing by 14.2%* as a result of higher usage and an expanding user base.
Data revenue increased by 49.6%*, driven by a growing user base and higher data usage. Data traffic rose by 42.9%, and the average data usage per subscriber grew by 33.6%, reaching 10.9GB. Smartphone penetration increased by 2.7pp to 58.2%, underpinning the rising demand for high-speed connectivity.
Fintech revenue grew by 21.6%* - with an acceleration in Q4 (up 38.3%*). This growth was primarily driven by the airtime lending product, XtraTime. From Q3, MTN Nigeria implemented a revamped customer acquisition strategy in terms of which the business streamlined incentive structures in the sales and distribution channels. MTN Nigeria also rationalised the sales force to improve the focus on service penetration, enhance monetisation and lower acquisition costs. This resulted in a significant decline in active wallets by 46.6%, alongside agents and merchants by 76.8% and 79.2%, respectively. However, transaction volume increased by 4.3%, indicating an improvement in the quality of the wallet base and a sustained demand within the ecosystem.
The digital services business gained significant momentum, achieving a 95.4%* increase in revenue. This growth was fuelled by the rising adoption of rich-media services and enhancements to the user journey experience. By year-end, rich-media subscriptions reached 9.8 million monthly active users, up by 22.4%.
The enterprise business saw a pleasing increase of 95.1%* in revenue, led by fixed connectivity, data services growth and the USSD revenue recognition. MTN Nigeria continued to see increased adoption of services boosted by the onboarding of new users.
EBITDA increased by 7.5%*, with the EBITDA margin down by 10.3pp* to 38.9%*. The once-off USSD debt recognition contributed a 1.3pp* uplift in EBITDA margin, while the opex savings of the revised tower lease contracts provided a 3.1pp* EBITDA margin benefit.
Adjusting for the negative effects of forex (13.7 pp*), the EBITDA margin would have been 52.6%*, highlighting the underlying strength and profitability of the operation. The performance was also adversely affected by VAT on tower leases (1.9pp*) and higher energy costs (1.1pp*). Excluding these combined effects, the EBITDA margin would have been 55.5%*.
Overall, MTN Nigeria recorded a loss after tax of R6.8 billion, albeit with a pleasing return to positive profit after tax of R1.4 billion in Q4. The result was impacted by forex losses arising from the revaluation of foreign currency-denominated obligations.



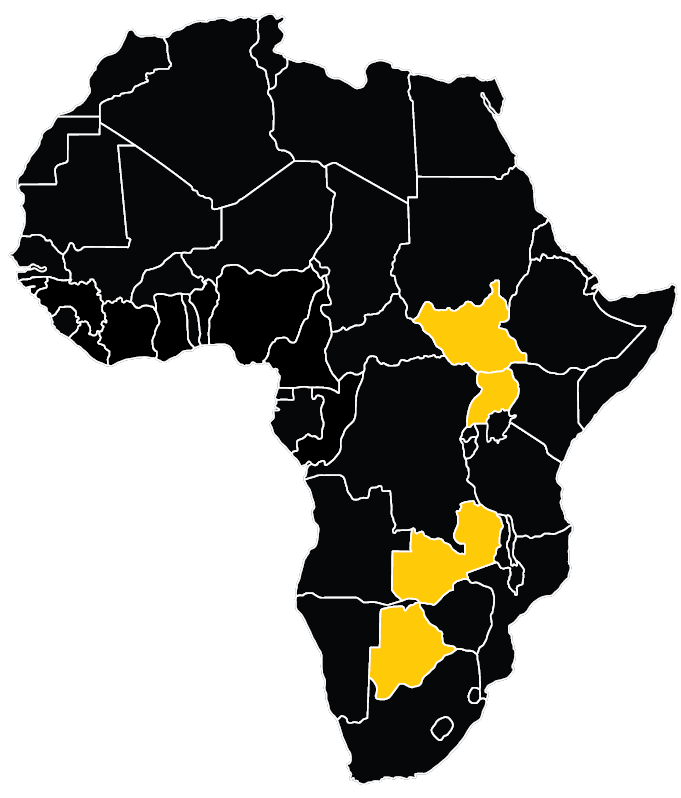
Service revenue increased by
21.3%*
Voice revenue increased by
14.8%*
Data revenue increased by
33.9%*
Fintech revenue increased by
23.2%*
Digital revenue increased by
4.8%*
EBITDA increased by
13.8%*
EBITDA margin decreased
by 2.7pp to
44.6%*
Capex of
R6.3bn
on IFRS 16 basis
(R3.6bn ex-leases)
The SEA region benefited from double-digit growth across all major service offerings and key Opcos, delivering a 21.3%* expansion in service revenue for the region in 2024, ahead of SEA's blended inflation of 10.3%. Overall subscribers increased by 7.4% to 42.2 million.
Data (up 33.9%*) and fintech (up 23.2%*) led the growth, supporting a robust performance in voice revenue (up 14.8%*). Data and fintech now make up 26.7%* and 29.7%* respectively of SEA service revenue.
EBITDA increased by 13.8%* in 2024, with the EBITDA margin decrease of 2.7pp* to 44.6%*, particularly reflecting the operational pressures in MTN Rwanda and MTN Zambia. More generally, SEA markets' EBITDA was impacted by higher commission and distribution costs, as well as higher network maintenance costs.
MTN Uganda delivered significant gains across all areas of the business in a dynamic operating environment. The strong performance was supported by solid commercial execution.
Service revenue grew by 19.6%*, in line with medium-term guidance, on the back of customer acquisitions, refreshed value propositions and continued network infrastructure improvement. MTN Uganda maintained its market share leadership with 22.0 million subscribers (up 13.2%), supporting voice revenue growth of 12.7%*.
Data revenue grew by 30.6%*, driven by a 22.4% expansion in data subscribers to 10.1 million and a 30% increase in smartphones on the network. This deepened smartphone penetration to 44.9% (2023: 39.1%). The growth was boosted by MTN Uganda's device financing programme and continued investments in 4G and 5G sites, which improved network quality. Data traffic increased by 49.0%, underpinned by a 21.7% growth in consumption per user (in megabytes).
Fintech revenue increased by 22.8%* driven by growth in fintech customer numbers to 13.8 million (up 13.9%). Basic services revenue grew by 19.4%* driven by increased wallet transactions; advanced services revenue up 39.4%*, on the back of growth in the payments and BankTech portfolio. This increased the advanced services revenue contribution by 3.0pp* to 28.7%*. MTN Uganda processed 4.3 billion transactions (up 26.6%) in the period.
EBITDA increased by 20.8%* due to strong topline performance and robust operational cost efficiency. Cost growth was contained, helped by lower inflation through disciplined execution of the EEP. The EBITDA margin improved to 52.2%*, up 0.8pp*.
Profit after tax for the period increased by 30.5%*, with an improved PAT margin of 20.2%* (FY 2023: 18.4%*).
MTN Rwanda made good progress in driving strong operational execution in 2024. Despite a challenging regulatory and competitive backdrop, we delivered resilient results with encouraging trends in some key financial metrics in H2.
Service revenue grew 4.6%, adversely impacted by the effects of a zero MTR directive, but with a pleasing acceleration in H2 (up 8.1%) and particularly in Q4 (up 13.6%). This was driven by improving trends in voice and data revenue performance, complementing a strong performance in Mobile Money, which delivered growth of 30.3% YoY.
We reported an EBITDA margin of 35.5%, down 10.9pp. Although the business reported a full-year loss after tax, it achieved a significant turnaround in Q4.
The subscriber base grew 5.1% YoY to 7.6 million. Active data subscribers decreased by 8.0% to 2.4 million, owing to competitive pressures, but we recorded an 8.0% expansion in our active MoMo user base to 5.3 million.



Service revenue increased by
9.7%*
Voice revenue increased by
9.5%*
Data revenue increased by
22.7%*
Fintech revenue increased by
28.8%*
Digital revenue increased by
2.8%*
EBITDA increased by
14.2%*
EBITDA margin increased by 1.6pp* to
41.4%*
Capex of
R11.0bn
on IFRS 16 basis
(R9.5bn ex-leases)
The WECA results in constant currency include seven months of MTN Guinea-Bissau in both the 2024 and 2023 periods.
Despite challenges in the macroeconomic and regulatory environment in key markets, WECA reported a 9.7%* rise in service revenue, driven by growth in data (up 22.7%*) and fintech (up 28.8%*). WECA service revenue was down 1.8%*, excluding MTN Ghana, reflecting the pressures on our businesses in MTN Côte d'Ivoire, MTN Benin and MTN Guinea-Conakry.
Subscribers increased by 2.0% to 69.9 million, against a backdrop of local currency volatility, particularly the Ghanaian cedi, regulatory interventions and intensifying competition. Large-scale undersea fibre cuts also affected the region, particularly in Q1. Inflation for WECA averaged 11.3% (4.4% excluding Ghana).
WECA reported a robust blended EBITDA margin of 41.4%* (2023: 39.8%*), reflecting EBITDA growth of 14.2%*. In the period, markets in the region were impacted by higher roaming costs, commission and distribution costs, as well as increased regulatory fees and network maintenance expenses. Excluding MTN Ghana, the WECA margin increased by 0.3pp* to 31.4%*.
MTN Ghana delivered pleasing growth through excellence in commercial execution, despite ongoing macroeconomic challenges.
Service revenue growth of 34.3%* was ahead of the targeted medium-term trend, albeit with voice revenue decreasing by 1.0%* due to a shift from traditional calls to voice over internet protocol services. MTN Ghana's ongoing investment in its network led to a 6.5% increase in the subscriber base to 28.5 million. Data revenue experienced significant growth, rising by 54.0%*. This increase was driven by a 13.7% rise in active data subscribers and increased smartphone adoption, which in turn led to a 19.0% increase in the megabytes consumed per active user per month. As a result, MTN Ghana saw a strong rise in data traffic (up 35.3%).
Fintech sustained a robust positive momentum with YoY revenue growth of 47.5%*. This growth was driven by a 12.8% expansion in active users, a review of the fee structure and significant growth in advanced services. Advanced services revenue was up by 82.1%*, led by payments and lending products.
EBITDA increased by 31.2%*, with a slight decrease in margin by 1.4pp* to 57.0%*. This was impacted by the challenging macroeconomic conditions in the market, including cost pressures due to higher inflation, as well as the base effects of the management fee not charged in the previous year, which affected the YoY comparison.
Adjusting for the management fee impact in 2023, a normalised EBITDA margin would have been 56.0%* in 2023, representing a 1.0pp* YoY margin improvement for 2024. MTN Ghana's PAT increased by 27.0%*.
MTN Cameroon sustained a growth of 11.9%* in service revenue in 2024, ahead of local inflation of 6.1%, led by data (up 20.6%*) and fintech (up 20.8%*). EBITDA margins expanded by 2.0pp* to 39.7%. The result was supported by disciplined commercial execution and attention to efficiencies, and achieved in a challenging and intensely competitive operating environment. MTN Cameroon maintained its market-leading position in terms of which subscribers grew by 5.1%, active data subscribers by 20.3% and fintech MAU by 3.4%.
MTN Côte d'Ivoire's service revenue declined by 8.3%* in 2024, affected by a challenging regulatory environment, intense competitive pressures and the large-scale undersea fibre cuts in the region during Q1. In this context, the overall subscriber base was 4.0% lower, and data and fintech revenues decreased by 0.2%* and 2.7%*, respectively. MTN Côte d'Ivoire maintained some commercial momentum with a 4.6% increase in active data subscribers. EBITDA decreased by 8.2%*, although the margin was slightly higher at 32.9%* (2023: 32.8%*), supported by accelerated expense efficiency measures and lower MTR costs.


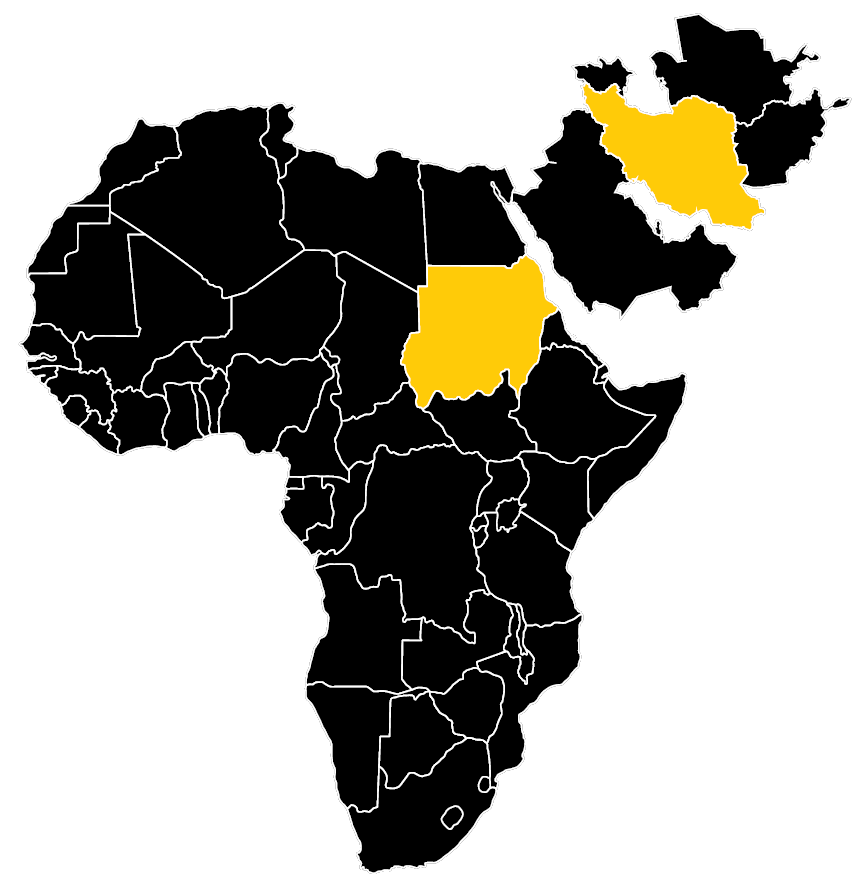
Service revenue increased by
41.6%*
Voice revenue increased by
36.8%*
Data revenue increased by
44.4%*
Fintech revenue increased by
30.0%*
Digital revenue increased by
75.9%*
EBITDA increased by
94.1%*
EBITDA margin decreased to
3.4%*
Capex of
R399m
on IFRS 16 leases
(R399m ex-leases)
The MENA results in constant currency include two months of MTN Afghanistan in both the 2024 and 2023 periods.
In the MENA region, we completed the exit of the consolidated Middle East subsidiaries in February 2024, with the sale of MTN Afghanistan, which is included for two months in the result. Service revenue for the region declined 41.6%*, with an EBITDA margin of 3.4%* (down by 30.7pp*). This outcome was largely due to the ongoing conflict in Sudan.
MTN Sudan continued to be affected by power outages and other disruptions to the network, due to the ongoing conflict. In February 2024, the network was shut down for a period of three months, although parts of it were subsequently restored during the course of the year. Accordingly, the business endured significant pressure on its ability to operate, with service revenue down 53.9%*, although with the rate of decline abating in H2. The EBITDA margin was 50.5pp* lower to -14.5%, also with an improvement into positive profitability in H2.
Irancell, our 49%-held equity-accounted investment, reported service revenue growth of 48.5%* as voice revenue grew by 9.4%* and data by 79.9%*, boosted by a tariff adjustment. EBITDA increased by 99.8%* with an EBITDA margin of 55.7% (up 14.5pp*). The equity-accounted profits of Irancell increased by 174.1%, including the benefit from a change in the treatment of regulatory fees, which moved from opex to capex, following regulatory amendments in the country.
The Snapp Group maintained its strong performance. Ride-hailing app Snapp remained the market leader, ranking among the top ride-hailing apps globally and reaching 5.3 million daily rides (2023: 4.7 million).
Last-mile delivery service Snappbox also remained the market leader, with revenue up 89% YoY and daily orders increasing by 31% YoY to almost 512 000. Food delivery app, Snappfood, grew revenue by 100% YoY and remained the largest player in the country.