


 40 / 108

Key financial tables
continued
Commentary
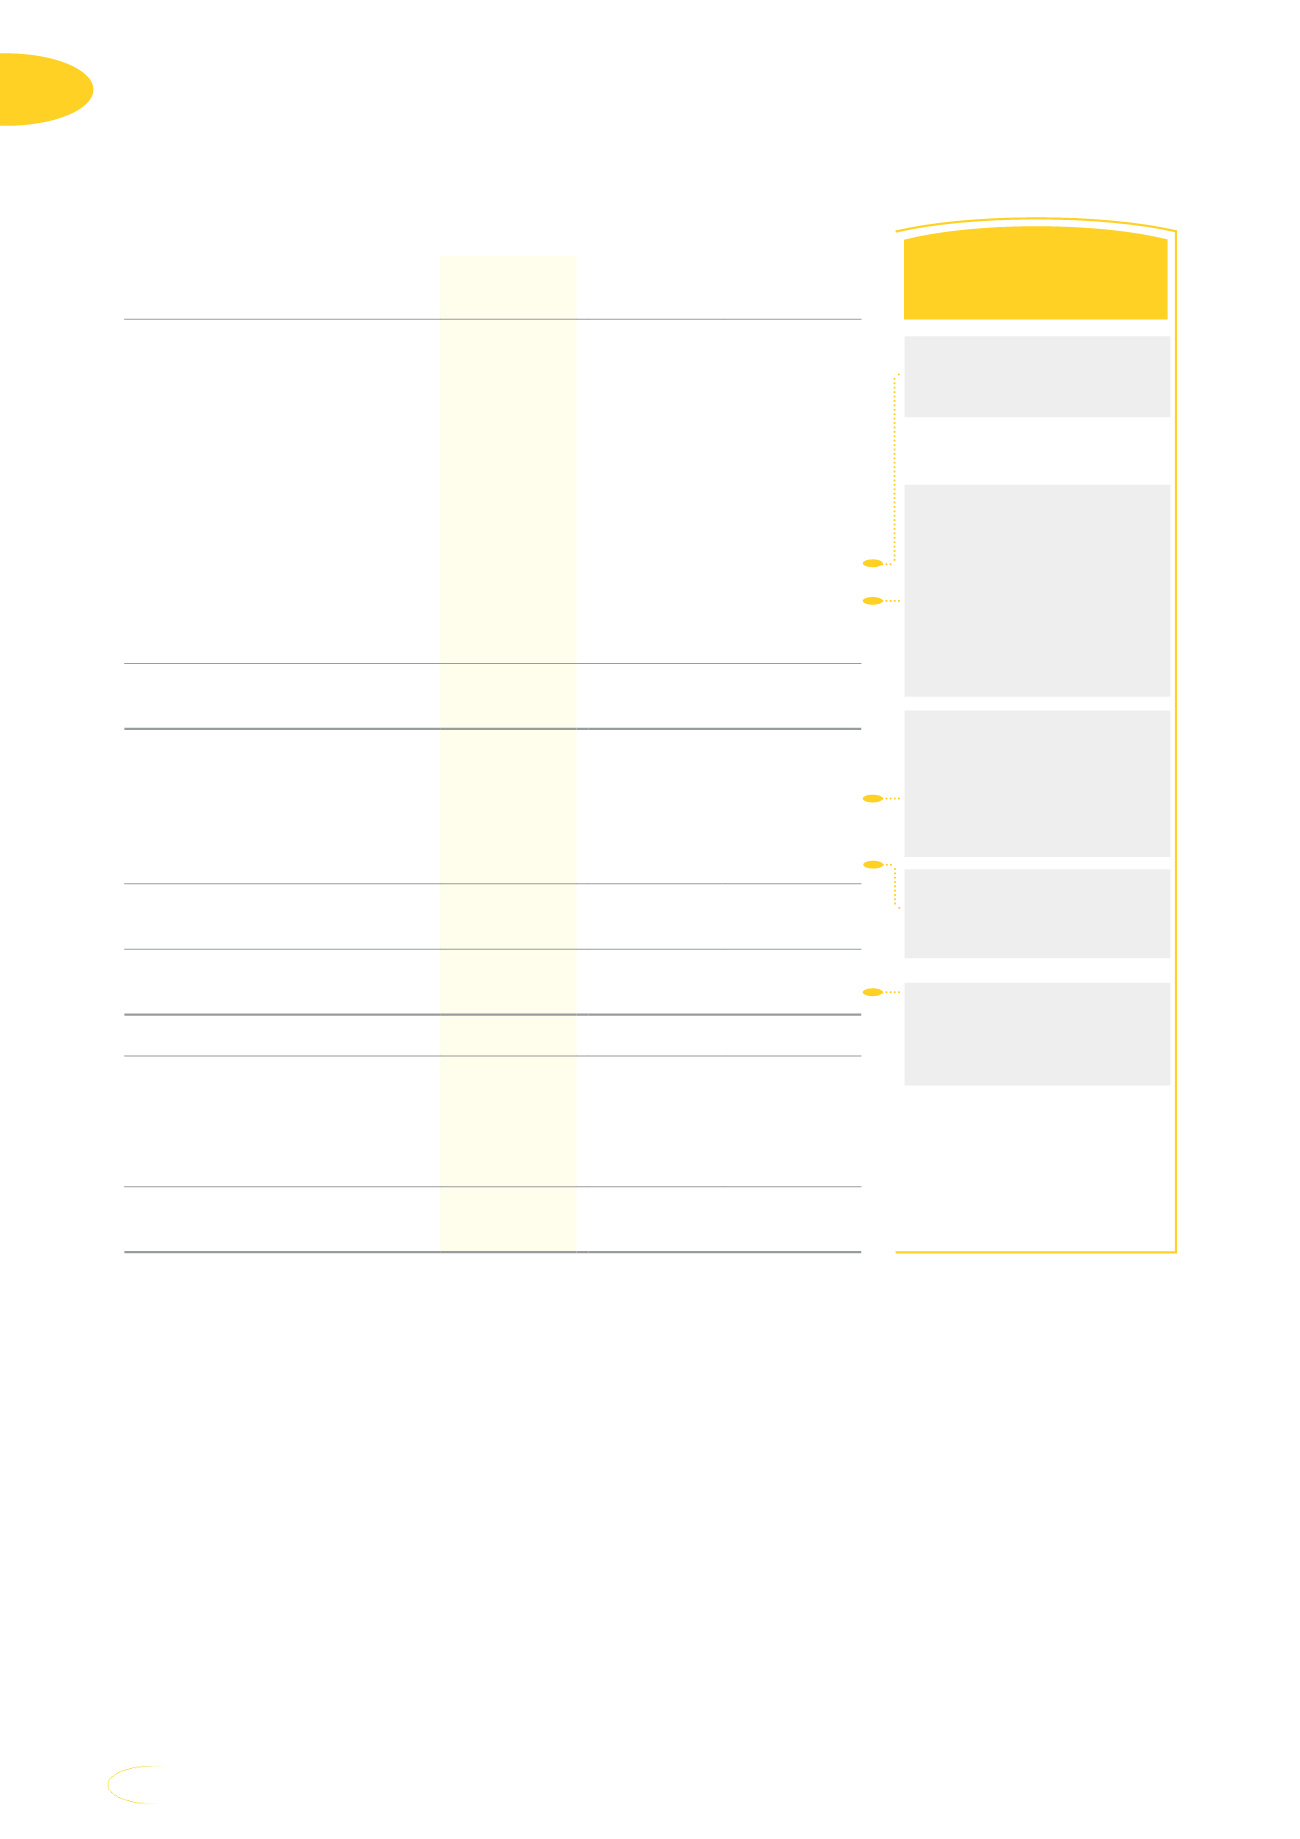
Selected cash flow information
2017
Rm
2016
Rm
Change
%
Cash generated from
operations
38 484
55 681
(30,9)
Dividends paid to equity
holders of the company
(12 565)
(19 792)
36,5
Dividends paid to non-
controlling interests
(956)
(1 178)
18,8
Dividends received from
associates and joint ventures
7 129
692
NM
Net interest paid
(802)
(2 983)
73,1
Tax paid
(7 596)
(11 704)
35,1
Cash generated by
operating activities
23 694
20 716
14,4
Acquisition of property, plant
and equipment, and
intangible assets
(26 661)
(35 247)
24,4
Movement in other investing
activities
(924)
(5 161)
82,1
Cash used in investing
activities
(27 585)
(40 408)
31,7
Cash used in financing
activities
(4 919)
20 951
123,5
Net cash movement
(8 810)
1 259
NM
Cash and cash equivalents at
the beginning of the year
27 375
34 139
(19,8)
Effect of exchange rates and
net monetary gain
(2 628)
(8 023)
(67,2)
Cash and cash equivalents at
the end of the year
15 937
27 375
(41,8)
This information has been extracted from the MTN Group Limited financial results for the year ended
31 December 2017.
Lower outflow in 2017
driven by lower interest paid
in Ghana, Sudan and head
offices, as well as higher
interest received in Nigeria
as a result of early
redemption of treasury bills
(which increased the cash
balance).
Includes dividends of
R6,5 billion received from
Iran.
Lower outflow in 2017 as
a result of Nigeria early
redemption of treasury bills.
Decrease driven by lower
capex spend in 2017 and
forex impacting translation
resulting in lower cash
payments in the year at
group level.
Net outflow as a result of
head offices repaying
borrowings facilities and
relating interest.
38
MTN Group Limited
Integrated Report 2017