


 39 / 108

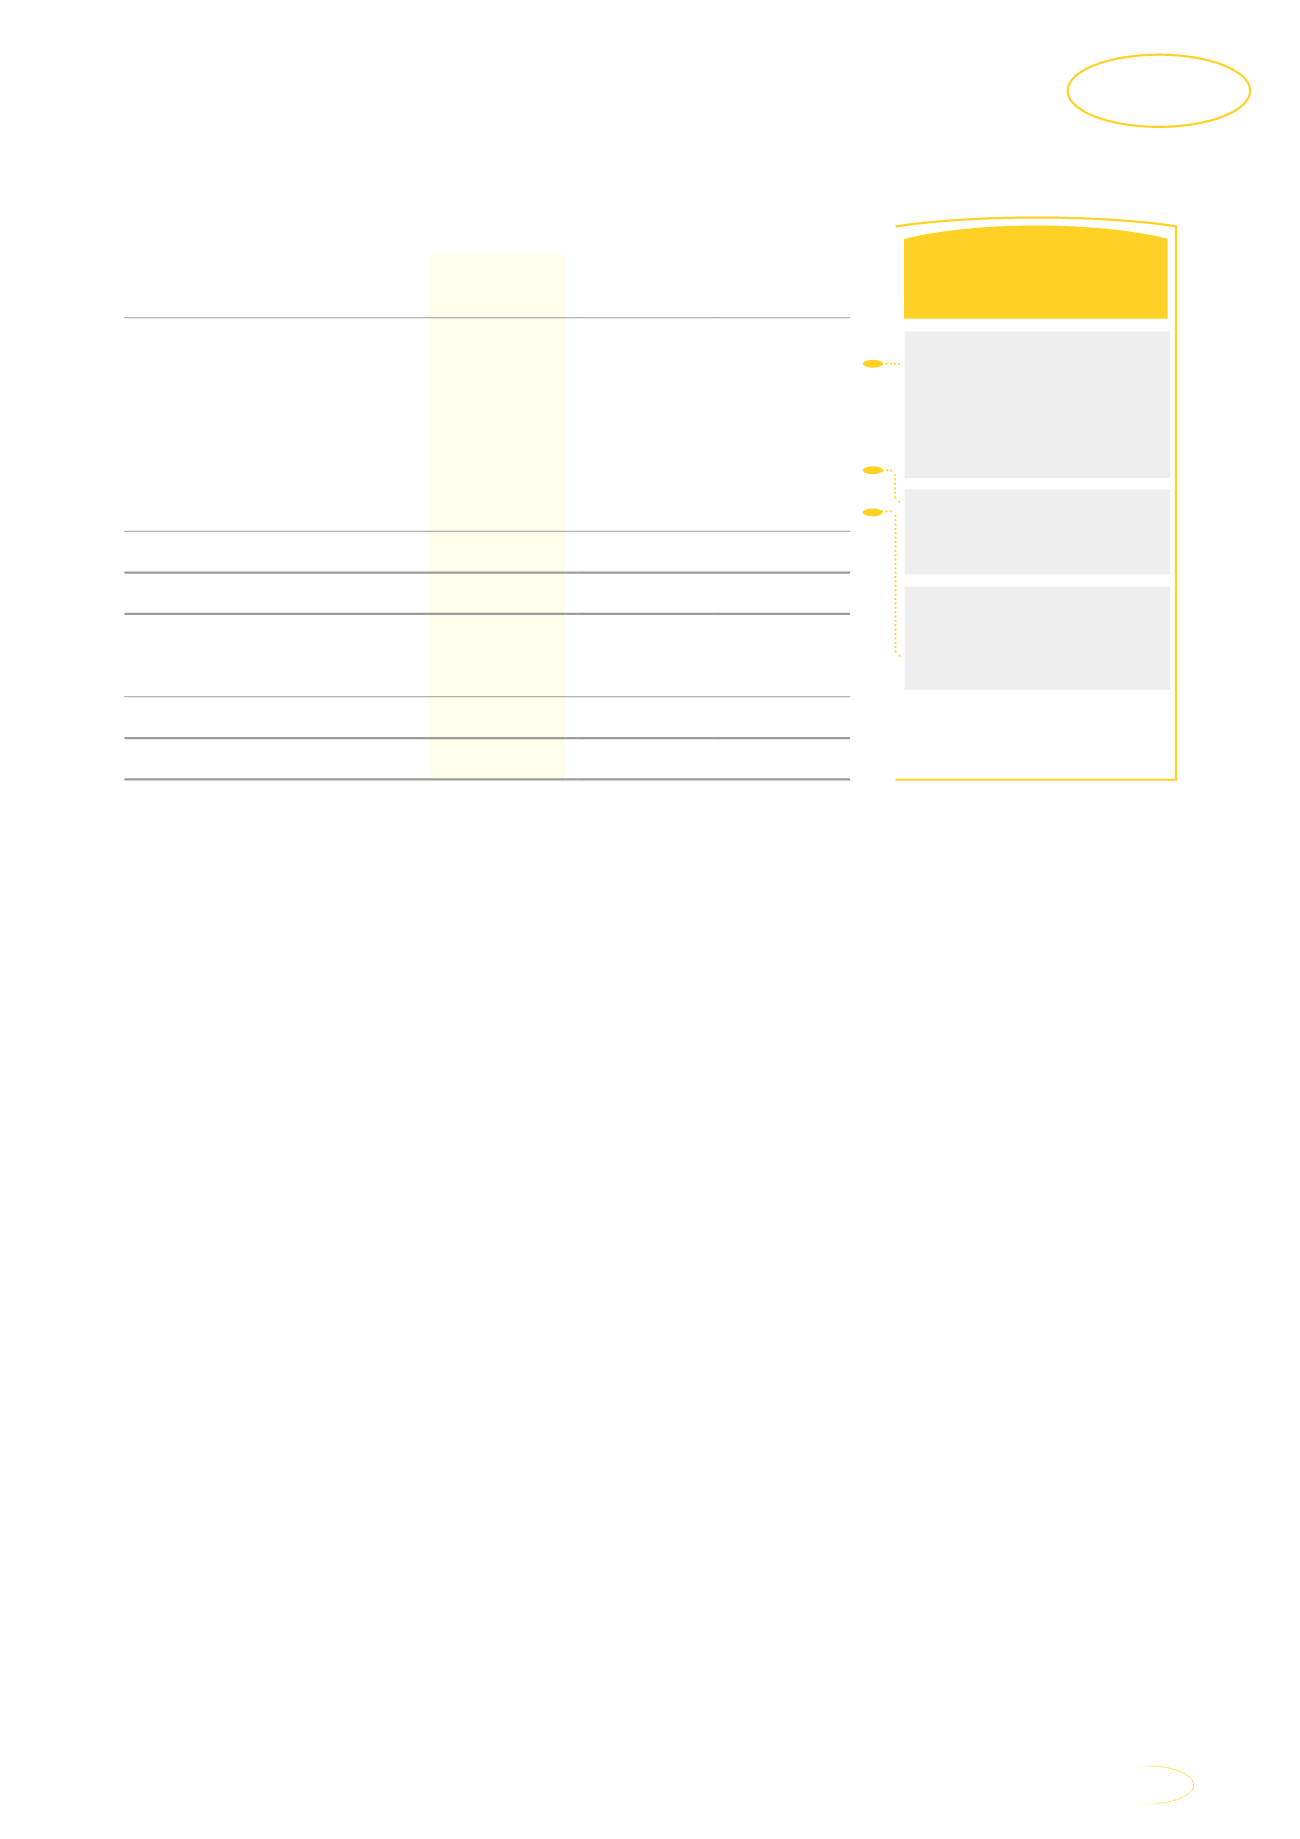
Selected financial position information
Net decrease as a result of
impairments (R2,5bn**),
depreciation (R19bn**) and
forex translation impacts
(R9,9bn**) offset by
additions of R28bn**.
Decrease as a result of
lower trade and other
receivables and lower cash
balances at year end.
Increase mainly as a result
of the exercise of the IHS
exchange right.
Commentary
2017
Rm
2016
Rm
Movement
%
Property, plant and
equipment
91 786
95 633
(4,0)
Goodwill and other
intangible assets
38 330
46 473
(17,5)
Other non-current assets
52 399
46 983
11,5
Current assets
59 900
79 611
(24,8)
Total assets
242 415
268 700
(9,8)
Total equity
94 267
105 231
(10,4)
Interest-bearing liabilities
79 720
86 954
(8,3)
Other liabilities
62 428
76 515
(10,6)
Total equity and liabilities
242 415
268 700
(9,8)
Net debt
57 145
51 902
10,1
This information has been extracted from the MTN Group Limited financial results for the year
ended 31 December 2017.
MTN Group Limited
Integrated Report 2017
37
Strategic and
financial review