



 6 / 96

The contribution of our regions
Where we operate and how we performed
Ivory Coast
(59%) ‡
Ghana
(98%) ‡
Nigeria
(79%) ‡
Cameroon
(70%) ‡
No 2 operator
32,6% market share
No 1 operator
56,4% market share
No 1 operator
48,0% market share
No 1 operator
57,1% market share
Technology coverage
#
2G – 95,17%
3G – 85,85%
LTE – 28,90%
Technology coverage
#
2G – 83,00%
3G – 43,50%
LTE – 28,00%
Technology coverage
#
2G – 89,79%
3G – 62,05%
LTE – 11,04%
Technology coverage
#
2G – 92,22%
3G – 64,00%
LTE – 37,70%
Subscribers
9,5m
+14%
Subscribers
19,3m
+19%
Subscribers
61,9m
+1%
Subscribers
9,9m
+8%
Data revenue*
up 18,4%
(19% of revenue)
Data revenue*
up 65,7%
(42% of revenue)
Data revenue*
up 10,8%
(21% of revenue)
Data revenue*
up 25,9%
(19% of revenue)
‡
MTN legal ownership.
#
Percentage of population covered by each technology.
* Constant currency (organic) information.
To strengthen operational oversight, leadership, governance and regulatory compliance
across our 22 GSM operations, in 2016 we reorganised the Group into three regions:
South and East Africa (SEA), West and Central Africa (WECA) and the Middle East and
North Africa (MENA). We also have a presence in Kenya and Namibia.
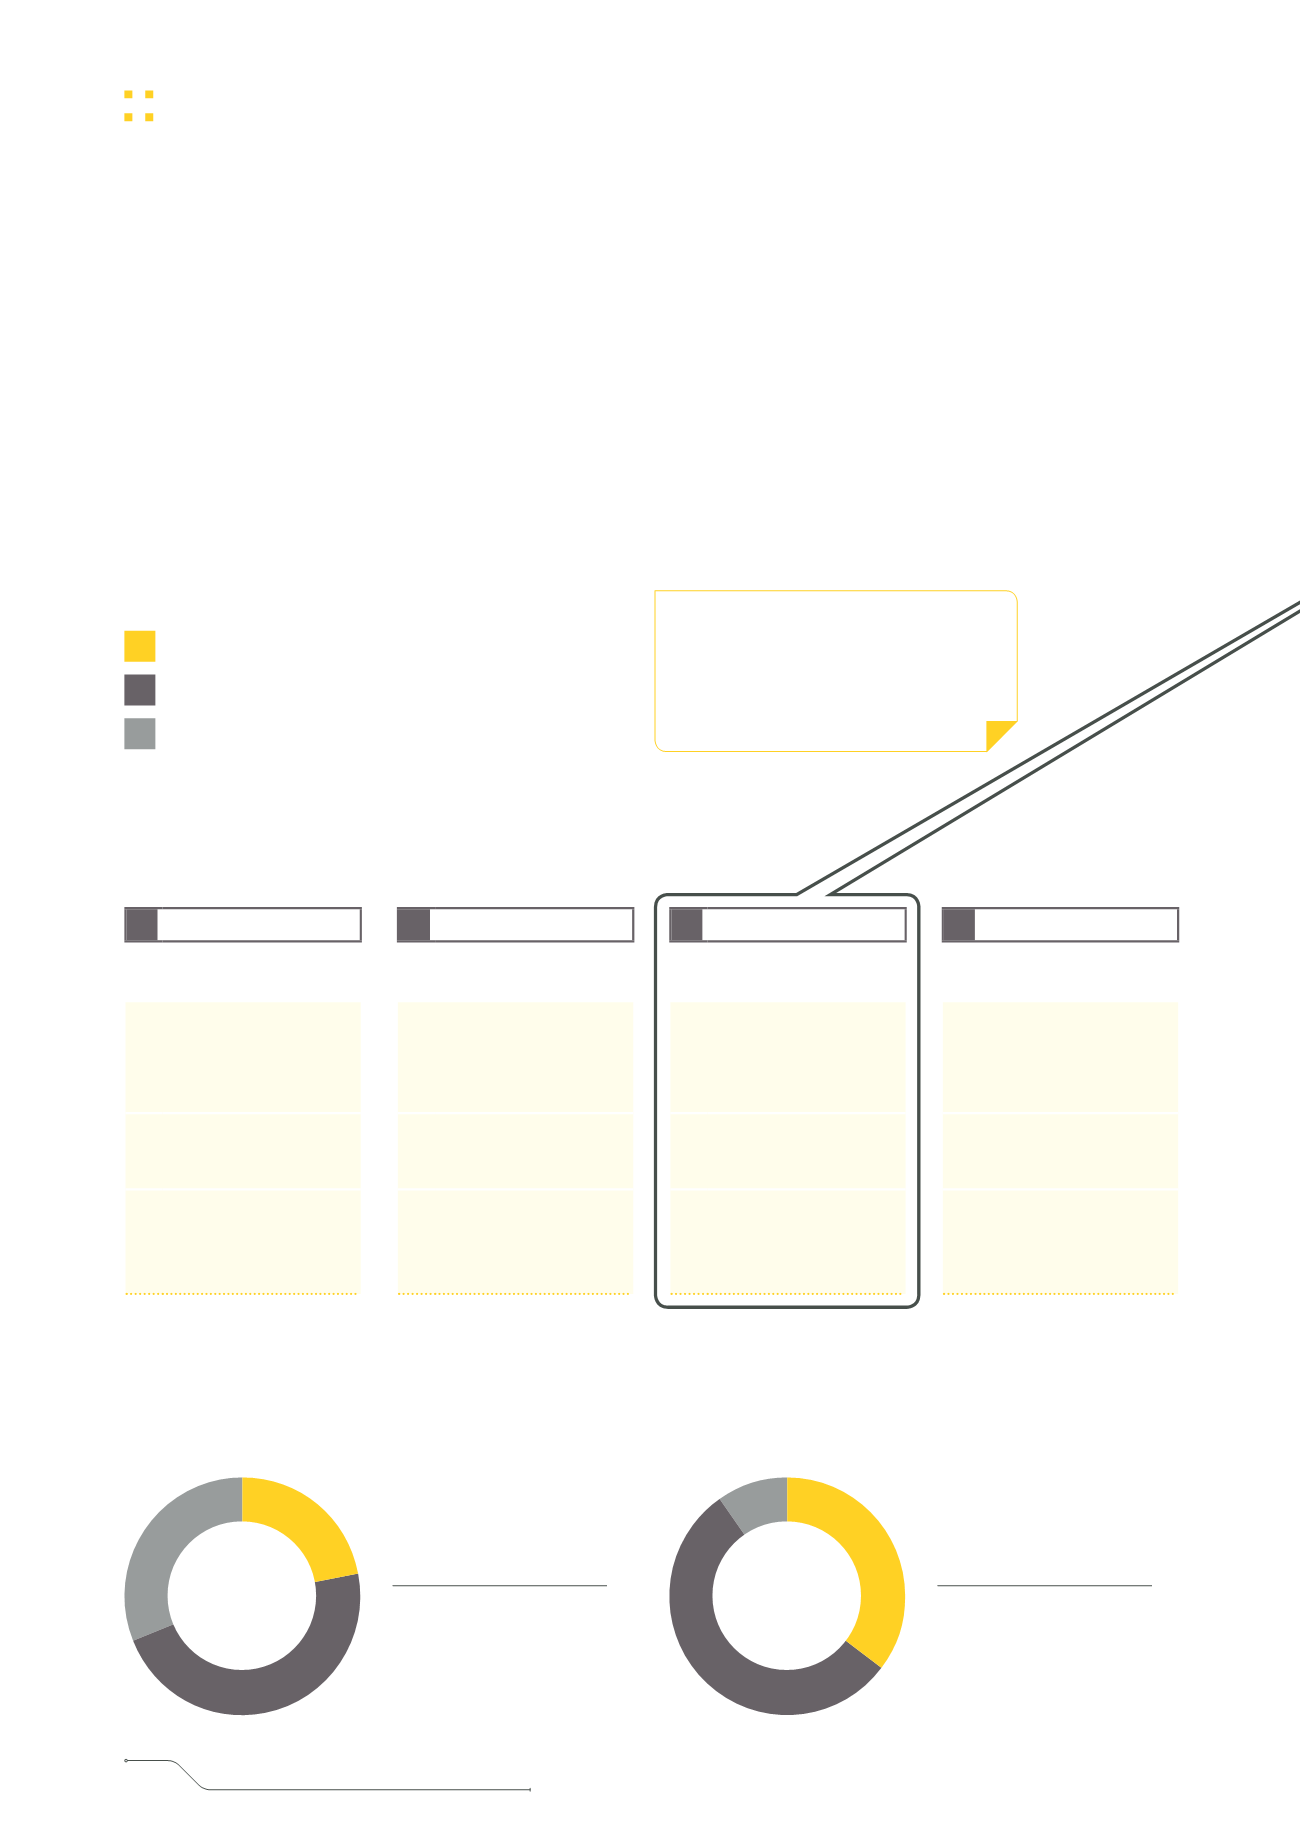
The WECA region is the biggest contributor to revenue and EBITDA, making up nearly
55% of revenue and almost 64% of EBITDA. It is home to 47% of our subscribers. Here
we provide key statistics for our top nine operations. In line with accounting rules on joint
ventures, in our contribution graphs we exclude revenue, EBITDA and capex numbers
for our joint venture in Iran, which are disclosed separately.
Subscribers
+3,3%
240,4
million
■
SEA
22%
■
WECA
47%
■
MENA
31%
Revenue
+0,4%
R147,0
billion
■
SEA
35,5%
■
WECA
54,9%
■
MENA
9,7%
SEA
WECA
MENA
MTN Irancell:
•
Revenue of R16,5 billion (+12,8%*)
•
EBITDA of R6,5 billion (+6,9%*)
•
Capex of R5,1 billion (+15,0%*)
MTN Group Limited
Integrated Report 2016
04