


 5 / 96

3
2
What we offer
Our products and services
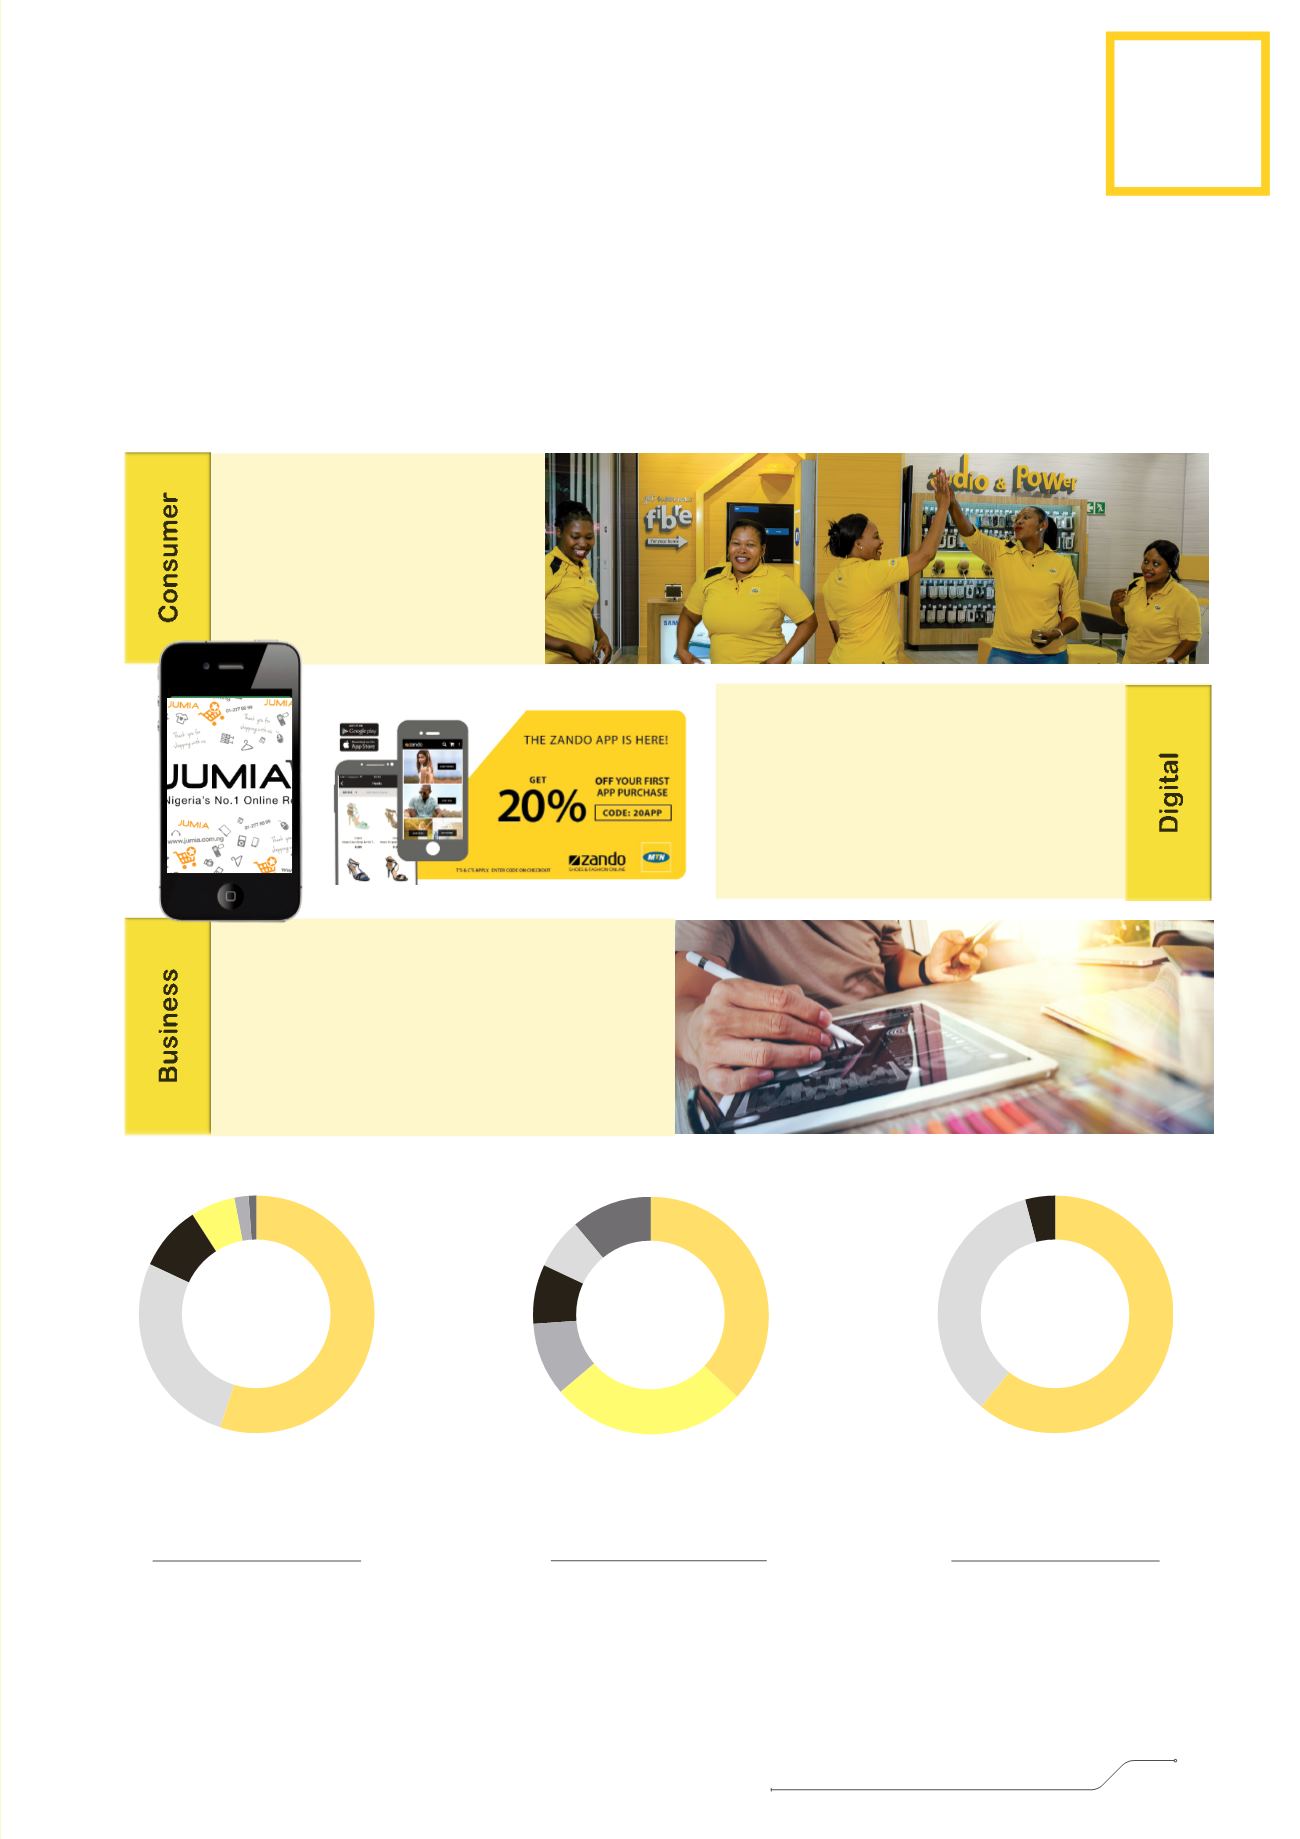
We offer consumer, digital and business services to customers across our footprint.
Consumer
revenue
■
Outgoing voice 55%
■
Data
27%
■
Incoming voice 9%
■
Devices
6%
■
SMS
2%
■
Other
1%
R147,0
billion
Cons mer
revenue
■
Outgoing voice 55
■
Data
27
■
Incoming voice 9
■
Devices
6
■
SMS
2
■
Other
1%
R147,0
billion
Mobile Money
markets by
subscribers
■
Ghana
37%
■
Uganda
27%
■
Nigeria
10%
■
Ivory Coast
8%
■
Rwanda
7%
■
Other
11%
15,4
million
active
users
il oney
r ts by
ribers
hana
37%
ganda
27%
igeria
10%
Ivory Coast
8%
Rwanda
7%
ther
1%
15,4
million
active
users
Business
revenue
■
Corporate
61%
■
SMEs
35%
■
Public sector and
partnerships
4%
R13,3
billion
Busi ess
revenue
■
Corporate
61
■
SMEs
35%
■
Public sector and
partnerships
4%
R13,3
billion
We connect people and
communities through
voice and data access
services.
We enable people to make financial
transactions using their mobiles, and
bring them entertainment and online
platforms, apps and online ventures
through lifestyle, mobile financial
services and e-commerce offerings.
We drive agility and growth through
connectivity,
communication
and
collaboration solutions over world-class
infrastructure, as a committed partner to
SMEs, corporates and the public sector.
1
1
2
3
MTN Group Limited
Integrated Report 2016
03
WHO WE ARE