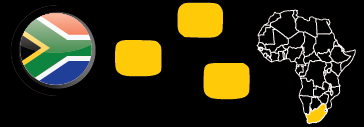
MTN South Africa delivered a resilient operational performance in a mature and highly competitive market, achieving 2% service-revenue growth, despite continued pressure in the prepaid segment. This steady performance underscores MTN SA's ability to navigate market saturation while supporting the Group's broader platform-led growth strategy.
 Service revenue increased by
2.0%
Service revenue increased by
2.0%
 Data revenue
 Fintech revenue decreased by
8.4%
Fintech revenue decreased by
8.4%
 EBITDA
 Wholesale revenue
 EBITDA margin


MTN Nigeria remained the strongest contributor to Group performance, posting 54.9% service-revenue growth in constant currency – one of the highest across the portfolio. The operation delivered a significant turnaround in profitability, reversing the prior year's loss. Nigeria's strong commercial execution also supported Group-wide expansions in data and fintech, contributing to higher data-traffic growth and rising adoption of Mobile Money and advanced digital services.
Service revenue
Fintech revenue increased by
79.5%*
Data revenue
EBITDA
EBITDA margin
The SEA region - including strong markets such as Uganda, Rwanda, Zambia and others - demonstrated robust momentum, particularly through the expansion of the MoMo fintech ecosystem. Uganda and Rwanda were among the largest contributors to the Group's 37.6% increase in fintech transaction value, supported by rising adoption of advanced services and improved macroeconomic conditions in several markets. SEA's operational resilience and fintech scale-up played a critical role in strengthening Group diversification and platform growth.
Service revenue
Fintech revenue
Data revenue
EBITDA
EBITDA margin
For 2025, we reported under our former operating model, which included the SEA, WECA and MENA regions. This has subsequently been updated.
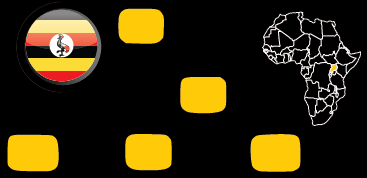
MTN Uganda reported strong results, supported by robust demand for data and fintech services, in turn enabled by significant investment to enhance network quality and resilience. There was a net increase of 1.9 million active data users to 12 million, helping boost data traffic by 42.3%. Smartphone penetration reached 42.8%, supported by device financing. The MoMo performance was strong, with brisk growth in advanced services.
 Service revenue
Fintech revenue increased by
17.4%*
Data revenue
EBITDA
EBITDA margin
Service revenue
Fintech revenue increased by
17.4%*
Data revenue
EBITDA
EBITDA margin
The WECA region delivered exceptional commercial performance, driven strongly by MTN Ghana, which reported 35.9% service-revenue growth and significant improvements in profitability. Ghana, along with other WECA markets, contributed meaningfully to the Group's data-revenue momentum, supported by rising data usage and expanding fintech penetration. The region continued to benefit from favourable regulatory conditions, network investments and strong customer-growth trends across voice, data and MoMo.
Service revenue
Fintech revenue
Data revenue
EBITDA
EBITDA margin

MTN Ghana reported a strong operational and financial performance, driven by the significant investment in its network and targeted commercial initiatives that have enhanced the customer experience. This enabled MTN Ghana to expand its customer base by 2.6 million, surpassing 31.2 million subscribers.
 Service revenue
Fintech revenue increased by
33.3%*
Data revenue
EBITDA
EBITDA margin
Service revenue
Fintech revenue increased by
33.3%*
Data revenue
EBITDA
EBITDA margin
While the Group's recent results are largely shaped by performance in sub-Saharan Africa, MTN Sudan operations continued to support overall Group stability through disciplined cost management, sustained network-quality improvements, and targeted investments to enhance digital-services adoption. Irancell is a 49%-held, equity-accounted investment.
Service revenue
Fintech revenue
Data revenue
EBITDA moved to a
EBITDA margin
improved to
34.7%*
by 40.9pp*