
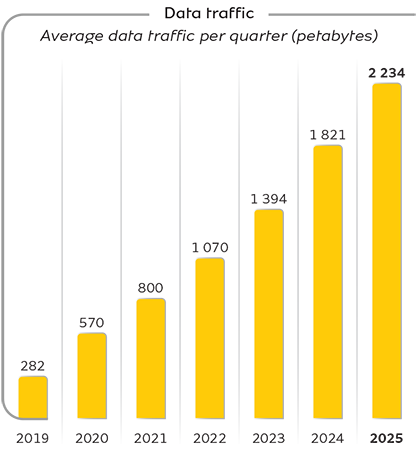
Data is the largest structural opportunity driving the growth of our business, and was the biggest source of service revenue for MTN in 2025. Our well‑invested networks and commercial innovations have supported strong growth in customers, with higher data usage and traffic. We are leveraging our substantial subscriber base of 307.2 million to further accelerate consumer mobile data through increased coverage and by providing affordable access.
Our investment case and outlook for medium‑term growth are underpinned by structural demand.
Our CHASE framework, introduced in 2018, guides us in overcoming the five key barriers to mobile internet adoption: coverage, handsets, affordability, service bundling, and education and ease of access.
Fulfilling the connectivity and communication needs of our customers
Ensure sufficient and affordable data coverage in rural and low-income areas

Increase the affordability of and access to smart devices

Ensure the fair and inclusive pricing of data services

Create inclusive, purpose-led offerings that are relevant, simple and meaningful to customers

Enhance digital literacy and ease with which data can be accessed

Performance in 2025
3G: 3 499
4G: 4 453
5G: 1 001
3G: 5.0m people
4G: 12.9m people
5G: 15.0m people
2G: 95.8%
3G: 92.6%
4G: 89.3%
5G: 17.3%
Group: 203.5 million smartphones
Scaling device financing in Nigeria, South Africa,
Uganda, Ghana, Côte d'Ivoire, Cameroon, Congo-Brazzaville, Rwanda
and
other Opcos through various partnerships
MTN is making good
progress
with partners on entry-level smartphone handsets
Reduced effective data tariff by approximately 14.4%
14 of our markets are within the UN-recommended affordability range within the UN's affordable internet usage target, with the price of 1GB of mobile broadband data costing 2% or less of gross national income per capita
27.0% increase in total data use (12.5GB per user per month)
Service offerings that are relevant, simple and meaningful to customers
Educated over 33 million people on digital literacy
Data literacy campaigns continue to address the internet usage gap across all our markets
Future focus
Grow data to be the largest contributor to MTN Group's total revenue. ST
Accelerate the CHASE framework to close the data usage gap. ST
Drive industry engagement to reduce handset costs. ST MT
Expand device financing initiatives to new markets. ST MT

Home broadband is a strategic growth pillar within MTN's connectivity portfolio. In 2025, the focus shifted decisively from opportunity creation to scaled operational execution, with an emphasis on sustainable growth, disciplined capital allocation, and consistent service delivery.
MTN addresses the home broadband opportunity through a hybrid access strategy, combining FWA on 4G and 5G with targeted FTTH deployments. This approach enables the Group to efficiently expand reach, adapt to diverse market conditions and balance rapid scaling with long-term investment discipline.
Across MTN's core markets, the addressable home broadband market is at least 55 million households, (with potential to reach 70 million depending on technology evolution), representing an annual revenue opportunity of around US$10 billion as fixed broadband penetration continues to expand.
Performance in 2025
Continued growth in the home customer base, supported by expansion of addressable households across priority markets.
Improved activation of customers from existing and newly expanded network reach.
Progress in deployment efficiency and operating discipline, supporting capital-efficient growth.
MTN's Home subscriber base (FWA and FTTH combined) increased from 1.53 million in FY 2024 to 2.45 million in FY 2025, representing net additions of approximately 926 000 customers (+61% year-on-year^).
Growth driven by FWA, as the primary engine for rapid scale across MTN footprint. FTTH expanded strongly on accelerated deployments and improved commercial traction in selected high‑density markets.
FTTH increased its share of the home base from 8% to 12%.
| ^ | The 7.0m total Home subscriber base comprises 2.45m FTTH and FWA subscribers and 4.55m MBB subscribers. |
Particulars


| ^ | Nigeria, South Africa, Ghana, Uganda, Cote d'Ivoire and Cameroon. Source: MTN network team; MTN internal home opportunity model. |

MTN's home connectivity strategy is built around a hybrid technology model, combining fixed wireless access with fibre deployments.
This allows MTN to optimally match technology to market conditions, ensuring capital efficiency and service quality.
Fixed wireless access > enables rapid and capital-efficient expansion across a wide geographic footprint. This allows MTN to scale broadband coverage using existing mobile network infrastructure.
Fibre deployment > focused on providing a premium experience in high-density urban and peri-urban areas where demand and population density support deeper infrastructure investment.
Leading fibre market positions in Nigeria, Ghana, and Uganda, supported by strong brand equity, extensive coverage and integrated connectivity.
Côte d'Ivoire gained momentum in 2025 supported by targeted network expansion and improved commercial execution, resulting in increased market participation and customer adoption.
Focus going forward
Key priorities include:
Scaling Home subscribers across FTTH, 5G FWA and opportunistic 4G FWA.
Maintaining discipline on deployment costs, ARPU, and churn.
Introducing digital offers, bundled services and value-added propositions to enhance customer lifetime value.
Scaling Operational Excellence programmes to ensure execution and sustainable margins.
Progress in 2025



Focus going forward
Continue to drive increased integrated bundle penetration percentage across our base. ST MT LT
Defend and grow our share of wallet through CVM initiatives and segmented customer propositions. ST MT LT
Close monitoring of voice pricing initiatives both above the line and below the line to ensure stability of voice effective rates across our footprint. ST MT LT