



 49 / 96

South and East Africa
Operational reviews
• Subscribers increased by 3,6% to
54,7 million
• Revenue increased by 7,9%*
• Data revenue increased by 14,5%*
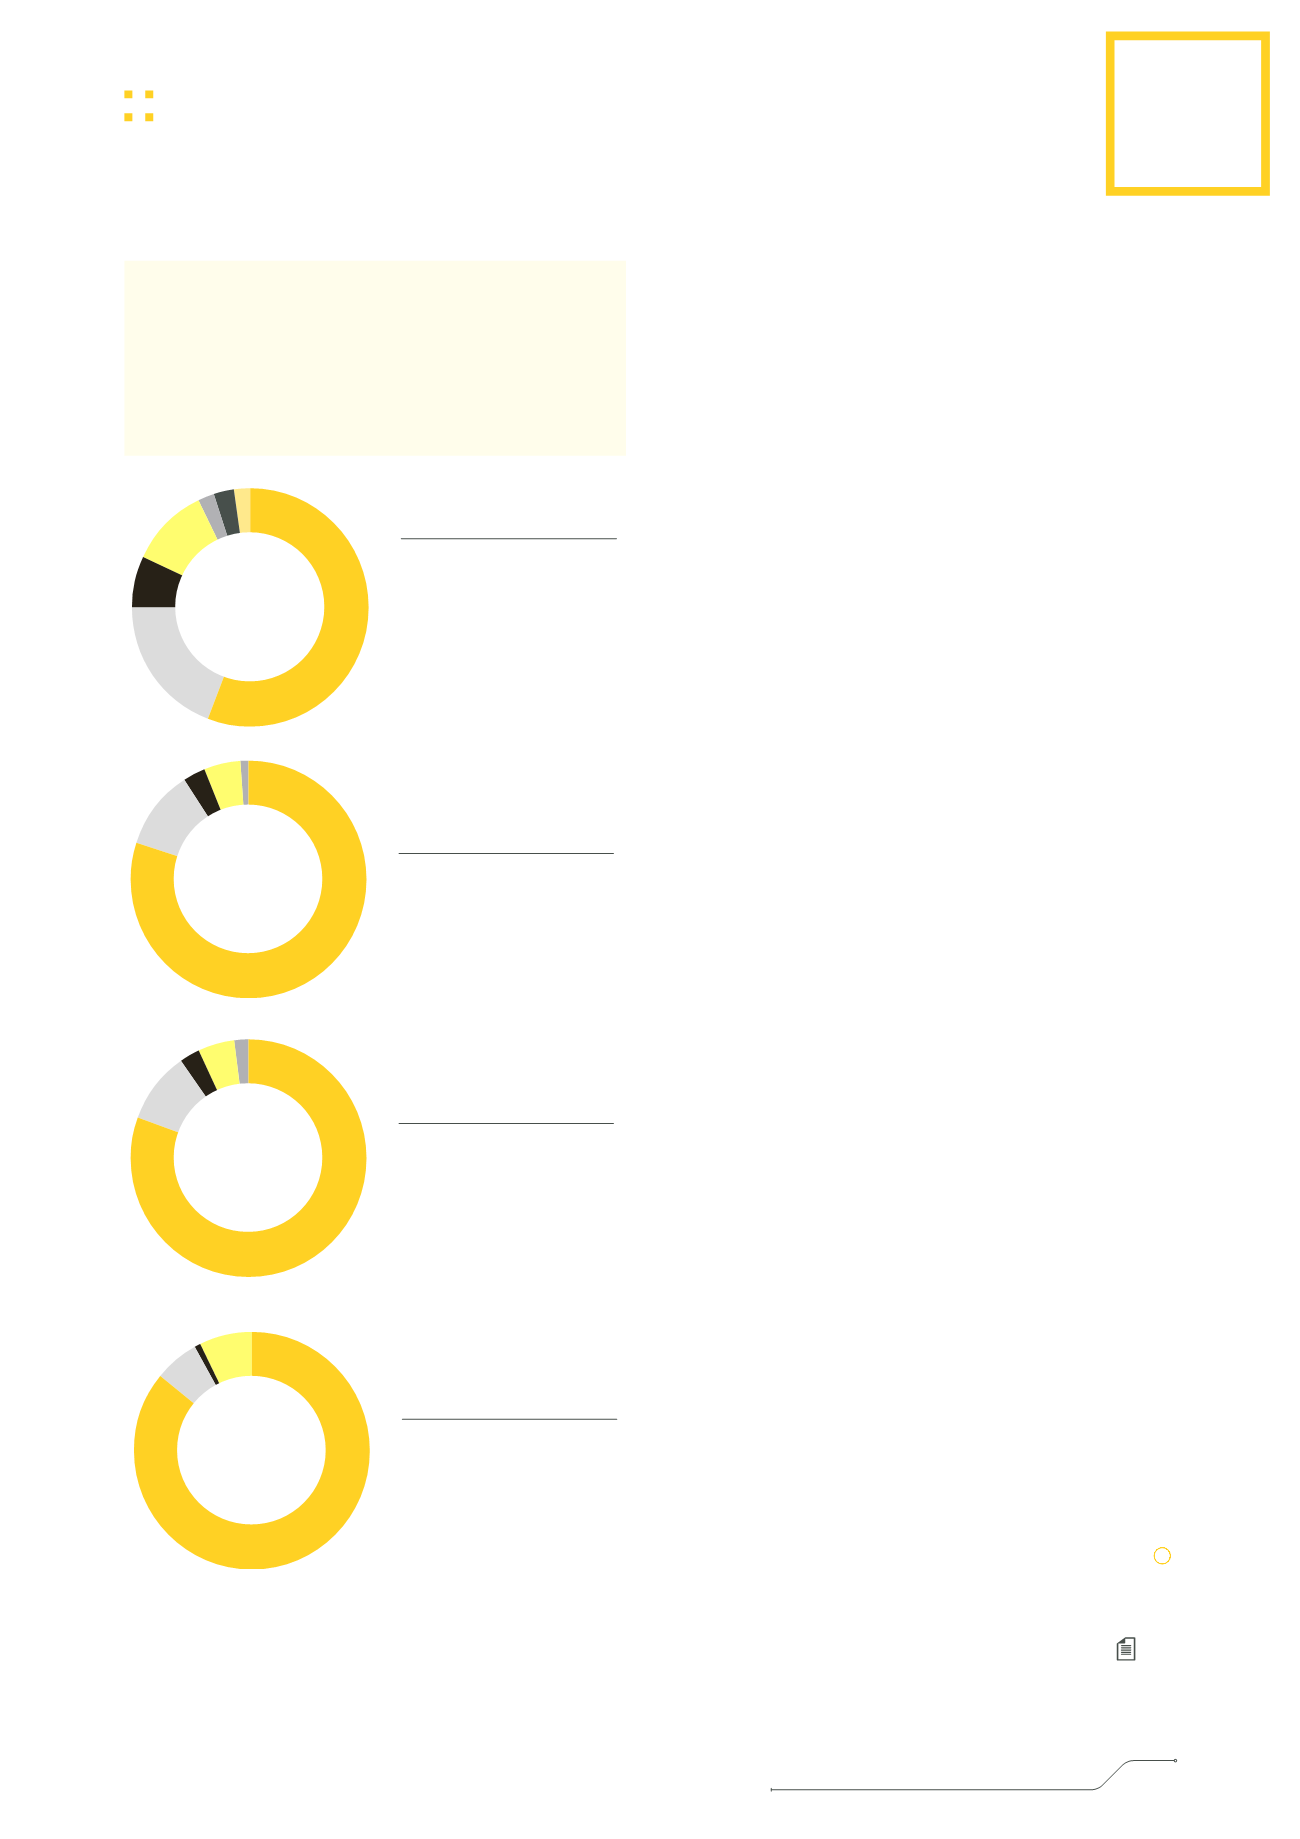
Subscribers
54,7
million
■
South Africa
56%
■
Uganda
19%
■
Rwanda
7%
■
Zambia
11%
■
South Sudan
2%
■
Botswana
(joint venture)
3%
■
Swaziland
(joint venture)
2%
Revenue
#
R52,1
billion
■
South Africa
80%
■
Uganda
11%
■
Rwanda
3%
■
Zambia
5%
■
South Sudan
1%
■
Business Group
0%
EBITDA
#
R16,4
billion
■
South Africa
84%
■
Uganda
10%
■
Rwanda
3%
■
Zambia
5%
■
South Sudan
(2%)
■
Business Group
0%
Capex
#
R12,9
billion
■
South Africa
86%
■
Uganda
6%
■
Rwanda
1%
■
Zambia
7%
■
South Sudan
0%
■
Business Group
0%
#
excluding joint ventures
Improving network quality and
aggressively selling smartphones
After a sub-optimal performance in the first six
months of 2016,
MTN South Africa
showed
a positive turnaround in the second half of the
year, benefiting from sharply improved 3G and
LTE network quality and aggressive sales of
smartphones.
South Africa’s economy remained weak,
overshadowed by the risk of a ratings downgrade,
and consumer spending was under pressure as
inflation ticked higher.
The operation’s subscriber base increased by 0,6%
to 30,8 million, driven by the prepaid segment,
which increased its base by 0,9% to 25,6 million.
The number of postpaid subscribers declined by
1,1% to 5,2 million, largely impacted by network
quality challenges experienced, as well as systems
and customer service issues in the first half of 2016.
Total revenue increased by 4,7% to R41 922 million
mainly as a result of device revenue. Service
revenue, which excludes device revenue, increased
by 1,9% for the period, driven by good growth in
data revenue. Data revenue increased by 11,4%,
contributing 34% to total revenue. The number of
smartphones on the network increased by 15,3%
(December 2015: 9,1 million restated to align to
Group definition) to 10,5 million as the number of
megabytes per user increased 46,7%.
Digital revenue gained momentum and contributed
16% to data revenue, thanks to both local and
international content.
MTN South Africa’s EBITDA margin declined by
0,5 percentage points to 32,9%. This was impacted
by foreign exchange losses on the cost of devices,
as well as an increase in the number of smartphones
and the change in the device mix from 2G to 3G and
LTE. This was further affected by costs related to the
expansion of our 3G and LTE network and increased
marketing costs. However, the operation reported a
5,4 percentage point improvement in EBITDA
margin in the second half, compared to the first.
Capex increased by 1,3% to R11 085 million for the
year, and retained a strong focus on 3G and LTE
network investment. The operation rolled out
1 134 co-located 3G sites and 1 538 LTE sites.
Benefiting from the network investments, MTN South
Africa’s net promoter score (NPS) gainedsignificantly
in the fourth quarter of the year compared to the first
half, increasing by 8 percentage points to 81%
LA
,
mainly driven by value and service. Quality of
service indicators including call set-up success
rate, dropped call rate and network availability on
2G and 3G networks improved from 2015 (see 90).
MTN Group Limited
Integrated Report 2016
47
PERFORMANCE
DETAILS