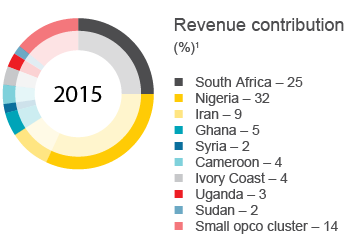
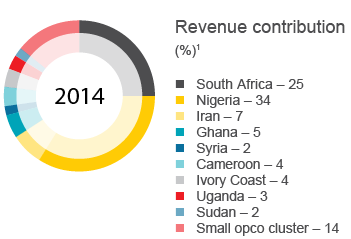
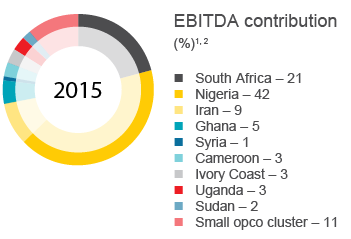
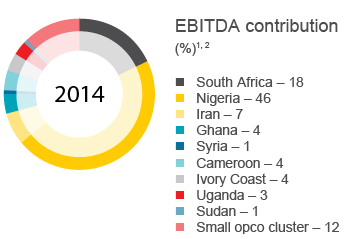
| |
The Group has identified reportable segments that are used by the Group executive committee (chief operating
decision maker (CODM)) to make key operating decisions, allocate resources and assess performance. The
reportable segments are geographically differentiated regions and are grouped by their relative size.
The Group’s principal activities include the provision of network IT services, local, national and international
telecommunications services; broadband and internet products and services; and converged fixed/mobile
products and services.
Operating results are reported and reviewed regularly by the Group executive committee and include items
directly attributable to a segment as well as those that can be attributed on a reasonable basis, whether from
external transactions or from transactions with other Group segments.
Unallocated items mainly comprise corporate expenses which do not directly relate to the operating activities of
the segments or which cannot be re-allocated on a reasonable basis. Segment results are determined before any
adjustment for non-controlling interests.
EBITDA is used as the measure of reporting profit or loss of each segment. |
1 Including Iran, excluding adjustments for hyperinflation and head office companies.
2 Excludes adjustments for profit on tower sales and the regulatory fine in Nigeria (refer note 6.3)
| |
|
|
|
Large opco cluster |
|
|
|
|
|
Adjustments to IFRS |
| |
South
Africa
Rm |
Nigeria
Rm |
|
Ghana
Rm |
Cameroon
Rm |
Ivory
Coast
Rm |
Uganda
Rm |
Syria1
Rm |
Sudan1
Rm |
|
Small
opco
cluster
Rm |
Major
joint
venture
– Iran1
Rm |
Head office
companies
and
eliminations2
Rm |
|
Iran3
Rm |
Profit on
tower
sales
Rm |
Nigeria
regulatory
fine
Rm |
Adjust-
ments
for hyper-
inflation
Rm |
Consoli-
dated
Rm |
| 2015 |
|
|
|
|
|
|
|
|
|
|
|
|
|
|
|
|
|
|
|
| Revenue |
40 038 |
51 942 |
|
7 903 |
5 806 |
6 424 |
5 148 |
2 605 |
3 472 |
|
23 290 |
13 660 |
(275) |
|
(13 660) |
– |
|
710 |
147 063 |
| EBITDA |
13 370 |
27 504 |
|
3 197 |
2 101 |
2 195 |
1 775 |
460 |
1 216 |
|
7 525 |
5 665 |
575 |
|
(5 665) |
8 263 |
(9 287) |
231 |
59 125 |
| Depreciation and amortisation |
|
|
|
|
|
|
|
|
|
|
|
|
|
|
|
|
|
|
(23 293) |
| Impairment of goodwill |
|
|
|
|
|
|
|
|
|
|
|
|
|
|
|
|
|
|
(504) |
| Net finance costs |
|
|
|
|
|
|
|
|
|
|
|
|
|
|
|
|
|
|
(3 010) |
| Net monetary gain |
|
|
|
|
|
|
|
|
|
|
|
|
|
|
|
|
|
|
1 348 |
| Share of results of associates and joint ventures after tax |
|
|
|
|
|
|
|
|
|
|
|
|
|
|
|
|
|
|
1 226 |
| Profit before tax |
|
|
|
|
|
|
|
|
|
|
|
|
|
|
|
|
|
|
34 892 |
| EBITDA margin (%) |
33,4 |
53,0 |
|
40,5 |
36,2 |
34,2 |
34,5 |
17,7 |
35,0 |
|
32,3 |
41,5 |
|
|
|
|
|
|
40,2 |
| Capital expenditure4 |
10 948 |
4 993 |
|
1 831 |
1 911 |
833 |
951 |
974 |
819 |
|
4 368 |
4 180 |
1 571 |
|
(4 180) |
– |
|
412 |
29 611 |
| Capex/revenue (%) |
27,3 |
9,6 |
|
23,2 |
32,9 |
13,0 |
18,5 |
37,4 |
23,6 |
|
18,8 |
30,6 |
|
|
|
|
|
|
20,1 |
| 2014 |
|
|
|
|
|
|
|
|
|
|
|
|
|
|
|
|
|
|
|
| Revenue |
38 922 |
53 995 |
|
7 149 |
6 194 |
6 418 |
5 289 |
3 449 |
2 701 |
|
22 385 |
11 631 |
(348) |
|
(11 631) |
– |
|
776 |
146 930 |
| EBITDA |
12 509 |
31 620 |
|
2 674 |
2 651 |
2 475 |
2 074 |
651 |
914 |
|
8 083 |
4 982 |
1 869 |
|
(4 982) |
7 430 |
– |
241 |
73 191 |
| Depreciation and amortisation |
|
|
|
|
|
|
|
|
|
|
|
|
|
|
|
|
|
|
(21 513) |
| Impairment of goodwill |
|
|
|
|
|
|
|
|
|
|
|
|
|
|
|
|
|
|
(2 033) |
| Net finance costs |
|
|
|
|
|
|
|
|
|
|
|
|
|
|
|
|
|
|
(3 668) |
| Net monetary gain |
|
|
|
|
|
|
|
|
|
|
|
|
|
|
|
|
|
|
878 |
| Share of profit/(loss) of associates and joint ventures after tax |
|
|
|
|
|
|
|
|
|
|
|
|
|
|
|
|
|
|
4 208 |
| Profit before tax |
|
|
|
|
|
|
|
|
|
|
|
|
|
|
|
|
|
|
51 063 |
| EBITDA margin (%) |
32,1 |
58,6 |
|
37,4 |
42,8 |
38,6 |
39,2 |
18,9 |
33,8 |
|
36,1 |
42,8 |
|
|
|
|
|
|
49,8 |
| Capital expenditure4 |
5 676 |
8 375 |
|
1 400 |
862 |
1 185 |
667 |
357 |
1 392 |
|
3 888 |
3 112 |
1 440 |
|
(3 112) |
– |
|
164 |
25 406 |
| Capex/revenue (%) |
14,6 |
15,5 |
|
19,6 |
13,9 |
18,5 |
12,6 |
10,4 |
51,5 |
|
17,4 |
26,8 |
|
|
|
|
|
|
17,3 |
1 Excludes adjustments for hyperinflation.
2 Head office companies and eliminations consist mainly of the Group’s central financing activities, management fees and dividends received
from segments as well as intersegment eliminations.
3 Irancell Telecommunication Company Services (PJSC) proportionate results are included in the segment analysis as reviewed by the CODM and
excluded from IFRS reported results due to equity accounting for joint ventures.
4 Capital expenditure comprises additions to property, plant and equipment, software and capital work in progress. |
The Group is domiciled in South Africa.
|